Cohen, Peter (1989),
Cocaine use in Amsterdam in non-deviant subcultures. In: Peter Cohen (1990),
Drugs as a social construct. Dissertation. Amsterdam, Universiteit
van Amsterdam. pp. 61-77.
© Copyright 1990 Peter Cohen.
All rights reserved.
1. The sample
Peter Cohen
- 1.1 - Introduction
- 1.2 - Method
- 1.3 - Age, gender and nationality
- 1.4 - Education, profession and income
- 1.5 - Marital status, children and living situation
- Appendix 1
Table of contents
1.1 Introduction
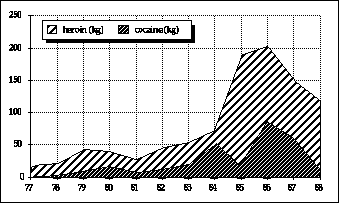
Recreational and habitual cocaine use in the Netherlands, as in other Western countries, is widely seen as a relatively new phenomenon. The social history of cocaine use in the Netherlands has not been studied recently. In so far as Dutch surveys on drug use report cocaine use, the percentage of respondents who report to have ever tried cocaine (the so-called lifetime prevalence) tends to be rather low (< 1%). The first national sample of Dutch residents from 15-24 years of age, specially drawn to investigate legal and illegal drug use in this cohort, was conducted as recently as 1983 (Sijlbing, 1984). Life time prevalence of cocaine for men was 4%, for women 2%, and 3% for the total sample. In the city areas of Amsterdam, Rotterdam and The Hague overall life time prevalence was 6%. In an experimental survey undertaken during 1984 and 1985 with pupils in secondary schools in Amsterdam, only two of 743 persons questioned reported ever having used cocaine (Visser et al, 1987). These studies were restricted to cohorts of adolescents and young adults (circa 12-24 years of age). Despite these findings, media commentators and experts tend to conclude that the use of cocaine is on the increase (Kaplan, 1985). Such statements are mainly based on police statistics, which report growing quantities of cocaine being confiscated, and observations in deviant subcultures, e.g. heroin addicts, prostitutes. These indicators seem to be rather unreliable estimates of the prevalence of cocaine use in a community (Korf, 1987b). According to Korf, statistics on confiscated amounts of illegal drugs indicate a boost in police activities more than an increase in use. Seizure data is presented in Figure 1.1.a, which shows large increases in both heroin and cocaine confiscations in Amsterdam.
According to Korf, heroin use in Amsterdam is either on the decline or has at least stabilized. This means that police statistics on confiscations probably cannot furnish a reliable estimate of the extent of drug use. Observed increases of the use of cocaine in deviant subcultures are even less reliable as indicators of the use of cocaine in general. The reason is not only the unsystematic nature of these observations, but also because cocaine use among these populations cannot be taken to represent cocaine use in the community. Research data based on deviant subpopulations (in- and outpatient treatment programs, prisons, etc.) are highly selective and biased. An even more important restriction on the generalisability of studies of deviant subcultures is that members' lifestyle usually can be characterized by polymorphous deviance, cocaine use being only one aspect. As a matter of fact, the supposedly causal relationships between cocaine use and all kinds of negative behaviour, be it social, psychological or physical, which can be found in the wide range of studies should be reinvestigated taking into account the complications of polydeviance.
Figure 1.1.a Confiscated heroin and cocaine in Amsterdam in kg (1977-1988) Source: Korf, University of Amsterdam and Narcotics Police, Amsterdam.
Source: Gemeentepolitie Amsterdam
Reliable data on trends in cocaine use in non-deviant environments does not exist in the Netherlands. There is no tradition of yearly household studies with nationally representative samples. Research that does not focus on prevalence but more on qualitative data about the social conditions in which cocaine is used in the community is totally absent. But, knowledge of the recreational and habitual use of cocaine in 'normal' populations is of great importance for the academic community as well as for policy makers. Such knowledge would enable us to make more reliable judgements on drugs and drug use. Therefore, studies of community based samples should be initiated.
Until now only a few studies on drug use have been undertaken with the explicit notion that choice of respondents might be an essential influence on results. Of course there is Zinberg's study on controlled users versus compulsive users (of heroin, marihuana and LSD), in which attention is directed to patterns of use and control mechanisms. But cocaine users are not part of Zinberg's studies of controlled use, because at the time (1972) "...marihuana, psychedelics and opiates were causing the greatest concern..." (Zinberg, 1984, p.5). Other scientists have conducted interviews with 'normal' users, but essential data on sampling procedures are vague (Ashley, 1975; Grinspoon and Bakalar, 1976; Phillips and Wynne, 1980).
The only social scientific surveys among cocaine users who are not recruited through treatment programs, by telephone 'help lines' or in prisons are by Morningstar and Chitwood (1983) and Erickson et al. (1987). The first study was designed to investigate differences between patterns of use and between groups of users. The research setting was Miami and data were collected from April 1980 to June 1981. A structured interview schedule was administered to a 'purposive' sample of 95 treatment clients and 75 non-clients all of whom reported cocaine to be a primary drug of use. Treatment clients were drawn from an existing population of cocaine users who recently had entered treatment, while non treatment respondents were selected through a snowball sampling procedure designed to tap a wide variety of separate user networks. The difference in the sex ratio, ethnicity and occupational level of the two user groups were not statistically significant. Cocaine dealers above the ounce redistribution level, adolescents under 18 years of age and upper class users were excluded (Morningstar and Chitwood, 1983; Chitwood and Morningstar, 1985).
The research challenge of the Toronto study (by Erickson et al) was to locate a group of fairly 'typical' cocaine users in the community rather than those who had presented themselves for treatment or who had been in legal difficulties. The principal criteria for selection in this study, in addition to use of cocaine at least once in the past three years, were that participants must be 21 years of age or older and must have been employed during at least six of the past twelve months. Housewives were considered employed. Students were deliberately excluded because as a group they were seen relatively detached from conventional adult roles and from community standards governing drug use behavior. A total of 111 participants were obtained from two separate sources. Potential participants were sought initially from friends and acquaintances of the researchers. These initial contacts led to additional interviews with the participants' friends, thus producing a snowball effect. When these personal networks became exhausted, after producing 47 participants, an advertising strategy was deployed. This included advertisements placed in Toronto newspapers, announcements broadcast on radio and television programs, and posted advertisements in various Toronto business establishments. A further 64 participants were obtained from the advertising campaign (Erickson et al. 1987).
Another study of cocaine users not recruited through treatment programmes is by Macdonald et al (1988), who interviewed 228 cocaine users who had been using two or more grams of cocaine a week during a period of 6 months or more. They found their respondents by snowball sampling in California, U.S. between July 1985 and October 1986. Median age was 30.5 years with 61% of the sample male and 39% female. This particular group is located "at the 'heavy' or extreme end of the use/abuse continuum" (Reinarman et al, 1988) and therefore not comparable with our group of respondents, where median amount of use during top period was 500 mg a week. Median amount of use during top period of use in the Reinarman sample was 5 grams a week. Results of this study reached us too late to be included in our comparisons between user groups in the U.S., Canada and the Netherlands.
1.2 Method
In our field study we wanted to assemble data on cocaine users who did not belong to specific deviant subcultures. The operational criteria defined for sample acceptability were simple: respondents should neither have been found guilty of a felony, nor should they have been in a drug treatment program at any time during the last two years. Full time prostitutes were also excluded. Apart from the instruction that we were not interested in 'junkies', these exclusion criteria were neither mentioned to our interviewers nor to the respondents. A minimum life time experience of 25 instances of cocaine use was required for inclusion in the sample. In comparison to Erickson's entry criteria of at least one instance of use in the past three years, and to Morningstar and Chitwood's entry criterion of 6 instances of cocaine use in the last year before the interview our entry threshold of at least 25 instances of cocaine use in life time seems high. This entry level was chosen to exclude very recently initiated users or experimental users, in order to create a data base of experienced users. Experimental users often stop after a few trials (see Siegel, 1985) and were thus excluded. For the present study we wanted information from normal people who had as much experience with cocaine as had deviant users.
Respondents were traced using a snowball sampling procedure with randomized sequences. This method appeared to be rather promising in an earlier field study among daily opiate users. It does not guarantee a random sample, but seems to be the best available way to select a cross-section of users who are as representative as possible (Korf and Van Poppel, 1986; Korf, 1987a).
We started the survey by recruting five cocaine users, mentioned by the staff of the project and by the staff of Motivaction, the agency that executed the main part of the fieldwork. Those mentioned were chosen because they certainly fulfilled the intake criteria. Each of these respondents was personally known to his referent who took care of establishing the contact with the interviewer. Interviews almost exclusively took place at the respondents' homes. The interview schedule was half structured. At the end of the interview, respondents were asked to mention all persons they knew who had used cocaine at least 25 times (including those who had stopped using). We set a maximum of 20 nominees. Respondents were asked to write the initials, age, gender, profession and assumed level of use of these people on a list. The interviewer then proceeded to select randomly two nominees from this list, one to be the next respondent in a chain of referrals and one for reserve. Later we changed to selecting four nominees, (of which two were for reserve) if the list of nominees was larger than ten. Random selection took place with a pack of playingcards.
The interviewee was asked to contact the first randomly selected nominee, preferably by telephoning while the interviewer was still there, to ask for cooperation. If this was given, his or her name was communicated to the interviewer, who took care to establish the contact, usually by making an appointment for an interview from the nominee's home. If the first selected nominee could not be contacted or approval was not given, the reserve nominee was contacted. If the reserve nominee also refused or could not be found, this 'chain of referral' was quit. The rationale behind this procedure was that we wanted to exclude the chance of being referred to nominees on the basis of unknown interviewee criteria. Random selection from each respondent's list of nominees would lessen the possibility of respondent preference. The respondent was not given any criterion for his selection of nominees apart from the remark that it would be useful if the nominee had at least a life time experience of 25 instances of use[1]. Unknown reasons for a respondent not mentioning certain potential nominees could not be excluded.
The step from one respondent to the next in the chain is called a 'wave'. A chain of two consecutive respondents has one wave, a chain of three consecutive respondents two waves, etc. We started with 'linear chains', where one respondent could be followed by only one other respondent in a wave. Later we decided, for reasons of efficiency and only in cases of longer lists of nominees (>= 10), to create the possibility of bilinear chains: two randomly selected nominees could be the next respondent in a 'forked' chain.
A main problem of the snowball method is the selection of the first respondents (the zero stage). In accordance with the methodology developed by San Franciscan researchers (Biernacki & Waldorf, 1981; Biernacki, 1986) we were prepared to initiate new snowballs during the period of interviewing in groups of cocaine users that were under represented in the sample, but who should be included. We expected, for instance, to have to invest extra energy in finding female users who we wanted to constitute at least 30% of the sample. This expectation proved wholly wrong. However, cocaine users under 20 years of age appeared to be missing from the sample. This contradicted the apparent association of cocaine with the younger generation, as frequently mentioned in the media. Some interviewers were explicitly instructed to initiate new snowballs among younger cocaine users. This did not succeed and it appears that other methods will have to be employed to find cocaine users in Amsterdam younger than 20 years[2] Sandwijk et al, 1988.
Of course the main effect of a specific choice of respondents in the zero stage is its predetermination of sequent respondents. By carefully choosing the zero stage respondents in other circles than those of junky type users we hoped to be able to remain in fairly non-deviant social areas. Of course this could not be guaranteed. If junky type users, or users heavily involved in prostitution or crime were part of the chains we would find ourselves in, such users would slip into the sample. This would however indicate that cocaine use was a habit that would bring 'normal' people in contact with these marginal groups. If such users appeared in our sample, we planned to delete their data according to our pre-set inclusion criteria.
During February, March and April 1987 a sample of 160 users was interviewed. A majority of 117 respondents (73%) were part of a chain of referral. In 43 of the cases (27%) such a chain could not be constructed.
Figure 1.2.a presents an overview of the snowballs per interviewer (A to U). 28 linear and 11 bilinear chains could be constructed:
- 17 linear and 6 bilinear one-wave chains, each one producing 2 and 3 respondents respectively.
- 6 linear and 2 bilinear two-wave chains, the first producing 3 and the latter 4 or 5 respondents each (interviewers J and O) .
- 5 chains have 3 waves (A, F/G and T; interviewer F passing his chains to interviewer G).
- 3 chains have 4 waves (E and I).
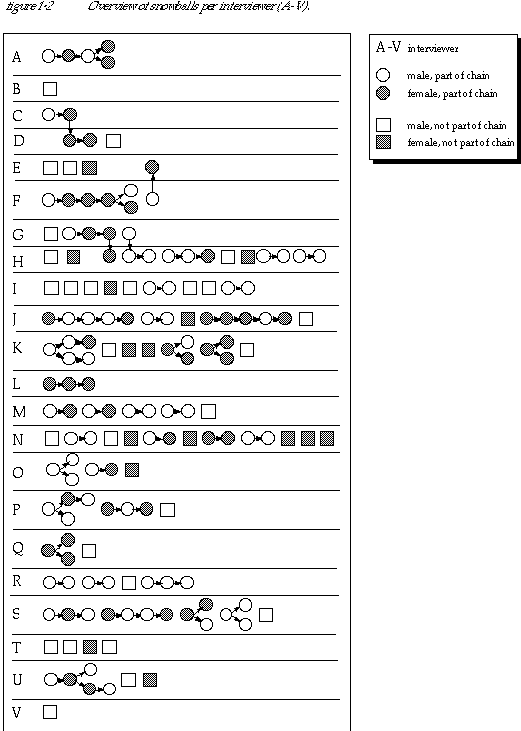
For the whole sample the mean chain length is 2 respondents (160/{43+ 28+ 11}). Even if the 43 loners are excluded from a computation of chailength, the mean chain length calculated for the respondents who do make part of a snowball is not more than 3 (117 / {28+11} ). In both cases the mean chain length is shorter than in the already mentioned field studies among daily opiate users that was based on the same sampling procedure. The snowballs in that study were all linear (with the exception of two) and the mean chain length, including loners (only zero stage, no waves), was almost 5. We do not know if this difference is mainly due to population characteristics or to the relatively high quality of the interviewers used for the opiate user study.
There is no significant correlation between chain length and age or gender. Loners are mainly found among the respondents who did not use cocaine during the last 3 months and among those who used more than 0.5 gram per week (see table 1.2a). The latter category is more frequently found at the end of a chain. There is however no significant correlation.
Table 1.2.a Level of cocaine use in the past three months related to different positions in chain of snowballs, in %

Meetings of staff members with interviewers lead to the assumption that one reason for not overcoming the zero stage is that some respondents knew their selected nominees mainly or exclusively from relatively anonymous social environments. They used to meet in bars, discotheques, concerts, etc., but did not know each other's family name, address or telephone number. Some interviewers had the impression that ex-users had little or no contact with current users. Also there were signals that the most frequent users showed a greater tendency to be unwilling to contact selected nominees, and this seemed to be especially true when the nominated respondent was their dealer. Although these observations do not seem illogical, there is no certainty about this because despite instructions, in many cases interviewers did not record why snowballs could not begin or why they ended. Improvement in this part of a snowball technique is very important.
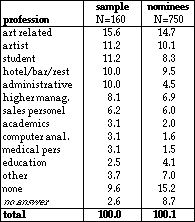
Although a flawless sampling procedure cannot be guaranteed in a snowball with random sequences, we preferred this method to recruitment through advertisements. Recruiting through advertising does not give any insight into groups or categories of non-deviant users that are not reached. A well executed snowball procedure with lists of nominees at least offers the possibility of a description of the total population of nominees and a comparison with the interviewed sub-sample. As far as age, gender and profession are concerned, our sample doesn't differ very much from the total population of nominees (see Appendix 1.2, and below). We have no detailed information about the level of use of the nominees that were not selected for interviewing. We did ask each respondent to write down if each nominee was an occasional, a regular, an intensive or an ex-user. But a comparison of use levels between those in the total population of nominees and those in the sample is difficult, because we do not know the criteria respondents might have used for the description of use level of nominees. However, in Appendix 1.3 and 1.4 we will make an attempt to do this, after we have analysed the level of use of the sample according to our own criteria.
After completing 160 interviews we found that 13 persons had been convicted for a felony in the last two years, and that 7 persons had participated in a drug treatment program. Two respondents scored on both variables. This total of 18 persons was checked on a number of variables like level of use, proportion of ex-users, income level and route of ingestion. We decided not to eliminate these respondents from the sample because the proportion of ex-users in this sub-sample was similar to the proportion in the total sample and because their level of use in the last three months before the interview was only slightly higher (not significantly). Moreover, their number was so small that we felt confident their inclusion would not or only slightly influence overall results.
We are tempted to interpret the proportion of users in our sample that had been in a drug treatment program during the last two years as an indication of the probability that a cocaine user will enter a treatment program. This is, unfortunately, not possible, because we do not know in what kind of drug program these users had been in and for which drug. But the small proportion of (ex) treatment clients we found (3%) remains very interesting, the more so since the prevalence of (other) drug use in this group is both varied and high (see Chapter 6). For an overview of the discrepancy between the 18 'deviant' respondents and the rest of the sample see Appendix 1.1.
The most important differences between this 'deviant' group and the rest of the sample is level of cocaine use during their top period, and the proportion of females. Level of use during their top period is very much higher with the 'deviant' group, and the proportion of females is much lower (17% vs 43%). Intravenous use during their top period is slightly higher, but not significantly.
In the following sections we will describe the sample on some general social and economic variables and compare the sample where possible with data on these variables from other studies.
1.3 Age, gender and nationality
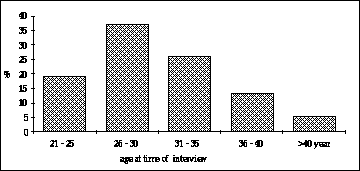
The age of the respondents varies between 21 and 53 years and the mean is 30.4 years (s.d.= 5.8). More than 75% of the respondents were between 26 and 35 years of age. (See Figure 3.1.a).
Although interviewers were explicitly instructed to initiate snowballs in younger cohorts, adolescents were not included in our sample. This might be an effect of the age distribution of the interviewers, being mainly in their twenties and thirties. But also in the most recent national youth survey (Sijlbing, 1984), and in a school survey in Amsterdam (Visser et al., 1987), cocaine use was hardly reported among adolescents. As far as cocaine use was mentioned in the first study, respondents almost exclusively were adults. The mean age for the 750 persons that were listed by our respondents on their lists of nominees was 32 years.
Figure 1.3.a Age distribution of own sample during time of interview (N=160)
In a household survey on drug use done at the end of 1987 in a representative sample of 4371 respondents from the Amsterdam population, life time prevalence of cocaine use was 5.6% (Sandwijk, Westerterp, Musterd, 1988). Previous 12 months prevalence was 1.6% (68 persons). There appeared to be only 3 users under twenty in the group that consumed cocaine in the year prior to the interview. Apparently the user group under twenty is extremely small, which explains our failure to find them using the snowball procedure. Assuming the group of previous 12 month users is an experienced group of cocaine users in the household survey, we will use it as a reference group for the cocaine users in our cocaine study[3].
The mean age of last year cocaine users in the household survey was 34.5 years, 26% were younger than 26, fifty five percent were aged between 26 and 35 years old. In age terms the respondents in our own survey are not completely representative for last year cocaine users in the general Amsterdam household survey, who are slightly older.
The age distribution in our sample does not differ much from the earlier mentioned Toronto sample, in which the mean age was 29.4 years (Erickson et al. 1987). The age distribution in the Morningstar/Chitwood sample is unknown.
Of the interviewed cocaine users in our cocaine study 40% are female and 60% male. We also asked our respondents to estimate which percentage of the other cocaine users they knew was male and which female. As a third way of establishing the male-female ratio we calculated the percentages from the lists of nominees. There is a striking agreement between these three data sources. Our percentages do not differ very much from the samples in the Toronto and Miami studies. In all cities the male: female ratio is approximately 3 : 2.
The male-female ratio for the previous 12 months cocaine users in the Amsterdam household survey is 63% male, and 37% female. This shows how accurately our respondents estimated the male-female ratio of cocaine users in their environment. We may conclude that gender distribution in our sample is representative for respondents in the Amsterdam household survey who used cocaine in 1987. There are no significant differences in age between the sexes in our sample.
Table 1.3.a Male-female ratio in community based samples in Miami 1981, Toronto 1983 and Amsterdam 1987, (with respondents' estimate, and of list of nominees), in %

Although from the meetings with the interviewers we know that most of the respondents were white, we can not present statistics on ethnicity. In the Netherlands it is very unusual to register race. (Kaplan, 1987.) The majority of the interviewed cocaine users was born in the Netherlands (88%). This is also true for a slightly lower percentage of their parents (81%).
1.4 Education, profession and income
The majority of the respondents have a rather high level of education (see Table 1.4.a). More than half are studying or have been studying at Higher Professional Level or University Level[4]. This is not far away from the educational level of the Toronto sample, where 65% ranked on a similar level (Erickson, 1987, p. 70). There, 18% of the respondents were still studying, 55% had finished their studies, and 27% quit the last study before it was finished. Overall, 24% of the sample had finished a study at Higher Professional Level or University Level.
Comparing the educational level of our sample with previous 12 months cocaine users in the Amsterdam household survey we find the following: 19% of the previous 12 months cocaine users have finished Higher Professional Schools or University versus 24% in our sample. Finished elementary or some Lower Level High School is the educational level of 29% of the previous 12 months cocaine users in the Amsterdam household survey, versus 23% for our sample. The differences are not significant.
Table 1.4.a Educational level, Amsterdam sample

Comparing the educational level of our sample to the age cohort in Amsterdam to which 95% of our sample belongs (20-40 years) is also possible.
In the general household sample the age cohort of 20-40 years (1953 persons) shows that 27% had finished studying at Higher Professional Schools or Universities. (We do not know what percentage of the household sample is still engaged in higher level education.) In our sample the proportion of highly educated people is 24%. Lower level education is for both groups about the same: 24% versus 23%.
These figures indicate that our snowball sample of cocaine users is representative for education, showing an almost similar level as shown in both the general population (age cohort 20-40 years) and a representative sample of previous 12 months cocaine users from this population.
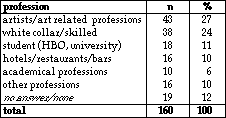
A large number of different professions was represented in our sample. We see a substantial proportion of artists and art-related professions (musician, painter, photographer, interior designer, journalist, antiques seller, etc.). Also there was a striking presence of bar, restaurant and hotel personnel. (See Table 1.4.b.) Together these sub-groups make up almost half of the sample. In this respect, the association of cocaine with people who do not conform to the rigid rules of a so-called normal working life seems not very far-fetched. On the other hand one should realize that the activities of these so-called free professionals are sometimes highly structured. Also a substantial part of the sample does belong to other professional groups, being associated with so-called normal working life (e.g. bookkeeper, computer system analyst). Comparing these figures with information from the household survey is difficult because of different classification systems.
Figure 1.4.a Net income per month (N=160)
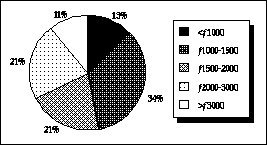
Table 1.4.b Professions of Amsterdam sample (N=160)
If we consider that almost half of the sample has an income of Ÿ 1,500 net per month (ca. US $ 750) or less, and that the income of almost 9 out of 10 respondents does not exceed Ÿ 3,000, we have to conclude that our sample does not represent, at least in the economic sense, an élite stratum of the population. One fourth of the sample lives from some form of social security, mainly payments from the national unemployment insurance (24% of the total sample). If we assume this percentage to be the percentage of unemployed, this is very similar to the 26% unemployed in the Toronto study.
Average net income in our sample is Ÿ 1,905 per month. In the group of previous 12 months cocaine users in the general household survey on drug use in Amsterdam, average income is Ÿ 1,930 per month, about the same as in our sample. Average income of the age cohort 20-40 years in the household survey is Ÿ 2,160, higher than that of the cocaine users.
Of the previous 12 months cocaine users in the household survey, 38.8% had some form of income from social security sources. This percentage is higher than in our snowball sample of cocaine users (31%), and much higher than the general age cohort 20-40 years (17.3%).
Summarizing, we see that the cocaine users in our sample have an educational background similar to their age cohort (20-40 years) in the general population and to the subgroup of previous 12 months cocaine users in the general population. Our cocaine users have a slightly lower income than their age cohort, but about the same income as the previous 12 months cocaine users in the general population. However, cocaine users in our sample live more often with an income from social security sources than their age cohort, but less often than the subgroup of previous 12 months cocaine users in the general population.
1.5 Marital status, children and living situation
The majority of our respondents are unmarried (84%). Of those who married, almost half are now divorced (7%). A substantial part of the sample has a partner, in many cases for longer than one year (47% of the total sample). More than one quarter live together with their partner (28%), either married or in common law and 63% of our respondents live alone. See Table 1.5.a.
The only partner data we have of another community based sample, stem from the Toronto study. They are not perfectly comparable. However, we see that the Toronto sample shows a proportion of singles (58%) which is very near the 63% in our sample. In Toronto 15% are separated or divorced (versus 7% in Amsterdam). In Toronto 26% of the sample lives with a partner, versus 28% in Amsterdam.
Table 1.5.a Partner and living situation, in %

Appendix1
Table A.1.1 Comparison of 18 'deviant' cocaine users with the rest of the sample and with the total sample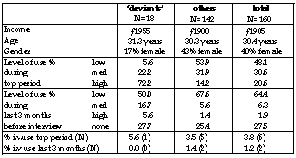
Table A.1.2 Comparison of sample with nominees on profession, in %
According to respondents, one out of every 5 users is an 'intensive' user (see Table A.1.3). This is consistent with the proportion of high level users during top period (see chapter 3).
We asked our respondents to qualify nominees on intensity of use: abstinent, occasionally, regularly or intensive use (see Table A.1.4). This is a very rough categorization, much less objective than level of use as computed later by us. But it allows us some form of comparison between our sample and the group of nominees. The category 'abstinent' appears to occur more often than our respondents assume. This is not very surprising. We asked respondents to nominate persons they knew as experienced users. It might very well be that nominated persons were acquainted during a period they were still using. If people in the meantime stop, or start a period of abstinence, this may very well be unknown to the nominator.
Table A.1.3 Comparison of level of use of sample with intensity of use of nominees
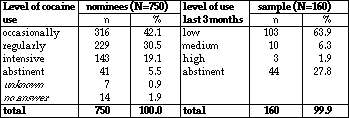
Table A.1.4 Level of cocaine use of nominated (ex)users, differentiated per own level of use

All respondents reported knowing other cocaine users. We asked them, apart from nominating specific persons, how many other users were personally known to them. 30% knew one to ten other users, 30% knew between eleven and twentyfive other users and 40% knew more than twentyfive. The average number of other known users is thirty seven. This very high average is pulled up by a few respondents who claim to know a high number of other users (100, 150, 400 and 500). Just by leaving these four respondents out lowers the average to thirty. Even that is high when compared to the number of reported nominees which averages at 4.7 per respondent.
Of all respondents 64% reports knowing 'risky users'[5] of cocaine with an average of 8 risky users known per respondent. This means that compared to the known number of other users (average 37) just over 20% of cocaine users are seen as risky users. In Appendix 1.5 we show quantities of other known users and known 'risky' users.
Table A.1.5 Number of known cocaine users and number of known risky cocaine users, in %
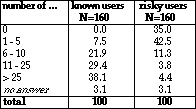
Under the heading of 'known users' percentages are given of respondents who know 0 other users, 1-5 other users, etc.(see Table A.1.5). Under the heading of 'risky users' the percentages are given of respondents who know 0 risky users, 1-5 other risky users, etc.
