Langemeijer, Marieke
(1997), The prevalence of illicit drug use in the general population
and in schools, as monitored by a number of different methods. Paper
presented at the Invitational Conference on Monitoring Illicit Drugs and
Health in the European Union, Amsterdam, 22 May 1997. Published in: Trimbos
Instituut (1997), Invitational conference on monitoring illicit drugs
and health. Final report. Utrecht: Trimbos Instituut. pp. 11-21.
© Copyright 1997 Marieke Langemeijer.
All rights reserved.
The prevalence of illicit drug use in the general population and in schools, as monitored by a number of different methods
Marieke Langemeijer
I have prepared a presentation that is not so much about the actual use of drugs in Europe or the Netherlands. I believe everybody can check the reports for that kind of information. Instead I will talk about some topics that people reading those reports and using the statistics need to be aware of if they want to make correct use of the statistics.
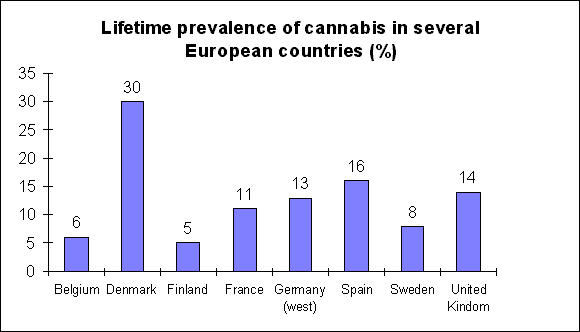 |
This graph represents the lifetime prevalence of cannabis use in some European countries. The question is: can we conclude from this graph that cannabis use is more prevalent in Sweden than in Finland? And is the situation in the UK and in Germany really more or less the same? The answer is: the statistics indicate that this is the case, but we can not be sure. To continue with the latter example: prevalence n the UK is 14 percent, in Germany 13. But the population studied is between 18 and 59 in Germany and between 12 and 59 in the UK. But this is not the only difference between the surveys. The German survey is a survey by phone; the British by face to face interview. The British figure was measured in 1992; the German in 1994. So are both countries really alike in lifetime prevalence of cannabis use? My answer would be: it could be, but we really don't know.
Getting clear information on the prevalence of drug use in the European Union is difficult, or at the moment maybe even impossible. There are numerous national research traditions, each with its own specific features, resulting in difficulties to compare statistics. Even within countries, the information often is not complete, consistent and up to date. In this presentation I will look at the problems that are caused by these flaws in the information and the problem of comparability of sources.
- sources of data
- working with data from different sources: the school survey and the general population survey
- prevalence of drug use in the population: the Dutch national population survey 1997
I will give an example of the problem of comparison by examining two Dutch sources of prevalence data and I will conclude with an outline of the national prevalence survey of 1997 that is being developed at the moment.
The central point is that the people working with data, for example to formulate a drug or health policy, face the difficult task of having to grasp the exact coverage of the data. Only then, statistics can contribute to an understanding of the drug situation in a national or international context. Sometimes, the limited availability of statistics forces people to work with multiple sources, which is a further complication of the task of the consumer of drug use statistics.
In the Netherlands, the most important sources of information on the prevalence of drug use are the following:
- local surveys. Amsterdam has known a time series since 1987 measuring the prevalence of drug use in the population of 12 years and over. This survey has had three occurrences so far. In 1995/96 two other Dutch cities have been studied using the same method.
- school surveys. Since 1984, three national school surveys were carried out, the fourth is about to be published.
- various other studies, some of which are ad hoc, others are only indirectly aimed at measuring prevalence. These include local school surveys, substance oriented studies, studies of user groups, analysis of sales etc. Also in this category is the national survey of the Central Bureau of Statistics that collects limited data on illicit drug use by youth in their General Social survey.
- estimations. Because of the lack of national prevalence data, several attempts have been made to estimate the national level of drug use, mainly based on the studies mentioned above.
Together, these studies do provide an image of the prevalence of drug use in the Netherlands, but it is important to realise that this image is rather incomplete and fragmented. In many other European countries, the situation more or less the same (EMCDDA, 1996).
Because of the fragmentation of the sources, it is very important to study the exact coverage of the existing data and to explore the relations between the different sources. In other words: if a national picture of drug use prevalence is drawn based on multiple sources, it must be crystal clear of what components this picture is made up. And it is not enough just to identify the sources. It is of vital importance to study what I would like to refer to as data quality. This general term covers issues such as:
- core items definition: items included in the survey, definition, formulation
- research population
- sample frame: the source of the respondents
- sample size, influencing how detailed data can be analysed
- sample type: the way that the respondents are selected
- sample stratification
- fieldwork methodology: mail, phone, interview, self administered versus interview administered etc.
- response/non response
- data manipulations such as using weights to correct statistics if the research population does not match the general population
Only with a good knowledge of these topics and their implications for the resulting data, it is possible to get a grip on the data and insight in the actual level of drug use in a country.
I will illustrate my point by comparing two sources of data. Suppose I want to know if youth in Amsterdam has different patterns of use than youth in the country as a whole. Two sources of data will serve my purpose: one is the local population survey of Amsterdam 1994 and the other the national school survey of 1992.
First, I will look at the points relating to data quality. The core items of the two surveys are not very different.
| Amsterdam Survey | School Survey |
|---|---|
licit drugs
|
licit drugs
|
illicit drugs
|
illicit drugs
|
| gambling | |
cannabis use of:
|
drug use/gambling of:
|
| leisure | leisure |
| treatment | |
| background variables | background variables |
Both surveys deal with use of roughly the same types of drugs, with lifestyle and with the background of the respondents. Differences are questions about treatment in Amsterdam and questions about gambling in the school survey. Broadly speaking, the surveys are comparable in terms of core items. Of course, it is not only the core items themselves that can cause a bias, but also the semantics and the sequence of items themselves that can cause a bias. But if we assume that differences of this type do not lead to alarming shifts in estimates, the core items of the surveys are comparable.
The other topics dealing with data quality, may have greater implications. I will not talk about this in great detail, but give a few examples.
| Amsterdam Survey | School Survey |
|---|---|
| Sample frame Population registry; ages 12 and over |
Sample frame Pupils of school classes of schools selected by local health organisations in 39 (of approx. 60) regions. Type of school pre-selected. |
| Sample size (net) 4364 |
Sample size (net) 10104 |
| Sample type Random |
Sample type Multistage (pre-selected), clustered |
| Sample stratification None |
Sample stratification Regions of health organisations |
Fieldwork methodology
|
Fieldwork methodology
|
Response/non response
|
Response/non response
|
Weights/imputations
|
Weights/imputations
|
The sample frame, the 'source' of the sample, is the population registry in Amsterdam for the Amsterdam survey, and a number of selected classes in selected school types in the school survey.
So the resulting figures cover completely different groups, that need identification before the statistics can actually be used. In the case of the Amsterdam survey this is relatively straightforward. The survey covers the population of the city of twelve years and over. In the school survey this is more complicated, because the sample frame is more diverse. First, there is a regional selection, caused by the willingness of health services to co-operate in the data collection. Secondly, a number of school types is selected and within schools of those types the number of classes is determined. In short, the Amsterdam survey is representative for the local population over 12 and the school survey represents youth in several types of schools and is national in scope.
Likewise, the response rate is an important topic. In the school survey the response rate is over 90 percent, which leads to the conclusion that the results probably represent the sample group very well. In the Amsterdam survey, the response rate is around 50 percent. This means that there is a possible bias in the results, stemming from a non-response group that may have different drug use characteristics that the response group.
Every item on this sheet has its own possible effects on the data, and for every topic, the user of the statistics needs to ask the question: what does this mean for the results? So in terms of data quality issues, there are many points that complicate the comparison of drug use of Amsterdam youth and drug use of youth in general.
I will now take this discussion one step further and include some of the statistics. If I still want to compare Amsterdam youth to youth in the country as a whole, could I just select the teenagers from the Amsterdam survey and compare them to the school survey group? The answer is no, because youth from the Amsterdam survey is a different group than youth from the school survey. Ignoring this difference has major consequences for the interpretation of the figures, as will be demonstrated by the following analysis.
These two questions are important in this respect:
- How well is the wider group of young people represented by a school survey?
And, if this is not the case:
- Are drug use figures of school youth likely to be higher or lower that those of youth in general?
I will answer these questions by using prevalence data from the Amsterdam population survey, while at the same time using definitions from the school survey.
The first step is to define the young people in the Amsterdam survey in terms of the school survey. In order to do this, I have calculated how many young respondents in the population survey fit to the school survey criteria in terms of school type. The results are shown in the next sheet.
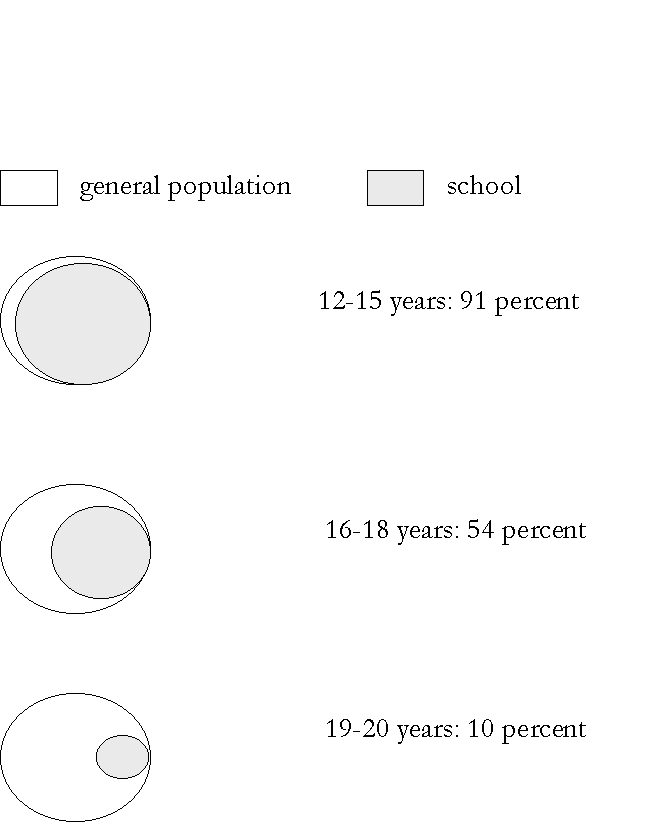 |
In this figure, the whole circle is the group of youth in a particular age group. The grey part is the proportion of Amsterdam youth that would also be part of the school survey because they go to one of the school types that are included in the school survey. The white part of the circle is the proportion of youth that would not be included in the school survey. There can be three reasons for this: they go to a different type of school, they are in part time education of they don't go to school at all.
The conclusion of this exercise is that school surveys measure drug use quite accurately for younger pupils, but that the older youth is underrepresented. Of all 12 to 15 year olds, 91 percent would also be part of the school survey sample, because they go to one of the school types included in the school survey sample. In the next group the overlap is approximately half. The rest of the Amsterdam youth in this age group is either in a school type that is not included in the school survey, goes to school part time or has already left school. In the next age group even more drop out of the school survey sample for these reasons.
So, if a comparison is made between youth in the Amsterdam population survey and in the school survey without looking into data quality issues, the result is a major misinterpretation of the statistics.
Of course the next step is, to what extent are prevalence figures misinterpreted? I will now give a few examples to show that substantial differences exist in the drug use of schoolchildren on one hand, and the wider group of youth between 12 and 18 years of age on the other.
Again, the statistics are based on the Amsterdam survey and the definitions of the school survey are copied on the Amsterdam statistics. To add some perspective I have also included the overall statistic for the Amsterdam population in the graphs.
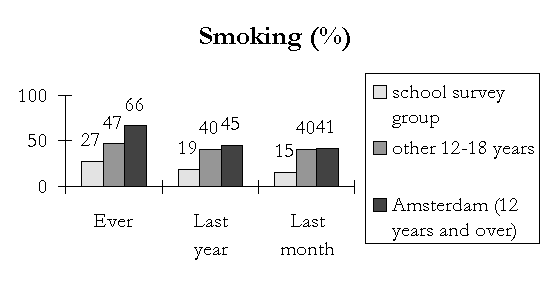
The next sheet represents smoking and drinking behaviour. Relevant to the present comparison are the first two bars of each bar group. The first represents the prevalence figure of youth that is defined by school survey definitions, the second is youth that does not match those criteria.
 |
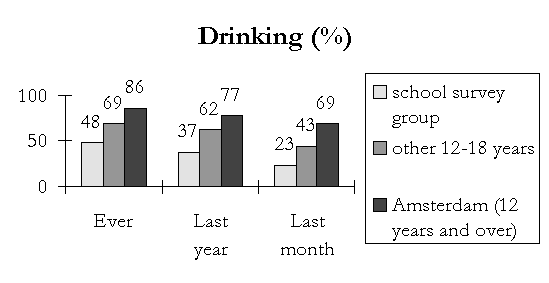 |
It is obvious that the difference in smoking and drinking behaviour is substantial. Current smoking for example, is 15 percent for the school survey group, and 40 percent for other youth. Likewise, current drinking is much higher in the group that does not match school survey criteria.
Cannabis use too, differs greatly between groups as shown in the next graph.
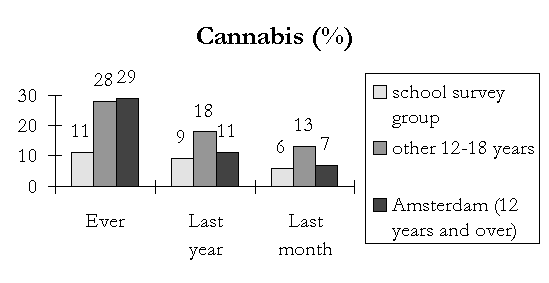 |
As expected, the prevalence of cannabis use is higher in the non-school survey group than in the school survey group. Interesting in this graph is that prevalence of cannabis use in the non-school survey group is higher than in the general population of Amsterdam (last year and last month prevalence).
It is beyond this presentation to explain the differences in detail, but one principal reason should be mentioned: the school survey group is much younger than the non school survey group. On average the former group is just over 14 years of age, whereas the latter is over 16. And because a lot of drug use starts (and increases) during teenage years, this difference is of crucial importance.
So, again returning to my objective to compare Amsterdam and Dutch youth, I can only do that with additional calculations on the Amsterdam data, and even then it is a tricky task, because other data quality issues (such as fieldwork methodology or sample techniques) are still different.
Of course, this was just an example, but the essence does not only apply to comparisons of school surveys and general population surveys but to all comparative research that is based on multiple data sources.
Also international comparative research can easily result in a distorted image of drug use when data quality issues are not considered. On top of the data quality issues that I have already mentioned, other topics may become relevant. Examples of those topics are different attitudes towards drug use in societies, leading to different biases, but also the semantics of different languages leading to differentialities in concepts in drug research.
The only way to resolve this problem, at least partly, is to eliminate methodological differences in prevalence research. Especially in the international context, this is a very difficult task. Each country has its own research tradition and its specific limitations for research methodology.
An alternative to the elimination of methodological differences between countries is to study the consequences of these differences. So if one country is used to conducting mail surveys and another has a tradition of face to face interviews, the object of research should be if mail surveys generally lead to higher, or lower, prevalence figures than surveys based on interviews. Likewise, it would be an interesting project to find out how drug use is perceived by different societies and how this influences the frankness of respondents.
In the national context, the mission to improve data quality may be an easier one. Cultural values may still vary among regions, but to a lesser extent. Differences resulting from the semantics of different languages in questionnaires disappear in most countries. Furthermore, countries have an infrastructure that, at least theoretically, enables the execution of a methodologically uniform national survey.
In the Dutch situation, the first step towards general population research on a national scale has just been made. The design of the research is more or less the same as the design of the local general population surveys in the Netherlands.
| Core items in the national population survey Lifestyle
Illicit drugs
Background
|
Core items are roughly the same as in the local surveys. New items are the use of doping and the use of several hallucinogens of which a growing number of users is assumed. Of course, we will not be able to measure the extent of this growth, if it exists at all, but at least we can get a starting point for measuring future developments.
| Sample frame | Population registry |
| Sample size | 22,000 |
| Sample type | Two stage (municipalities/person), random |
| Sample stratification | 9 strata: 4 cities (Amsterdam, Rotterdam, The Hague, Utrecht 5 strata based on population density |
| Oversampling | Youth 12-18 |
| Fieldwork methodology | Face to face Computer aided Interviewer administered |
| Response/non-response | Interviewer training Non response survey |
| Data manipulations | Decided at later stage |
The sample of this survey is stratified, which means that the country is first divided into 9 different strata before drawing the sample. The strata are based on population density and range from basically rural to highly urban. The survey will produce representative results for each of these strata, which enables us to study differential developments of drug use in different settings
Amsterdam is a separate stratum because we want to continue out time series that we have started in 1987. The survey of 1997 is the fourth consecutive survey, thus permitting analysis of drug use over a period of 10 years.
Youth is oversampled because the teenage years are a phase of life in which drug use may have a greater relevance than in other stages. Most use of licit drugs starts during these years, as does some experimenting with illicit drugs in certain subgroups. The oversampling of youth permits a detailed study of drug use in this group.
The fieldwork methodology is basically the same as in the local predecessors of the national survey, the only change being the switch from paper questionnaires to computer aided interviewing. In Amsterdam 1994 we used both paper and computer questionnaires to study the consequences of this change in methodology. Because no great shifts were found, computer questionnaires have now been introduced as the sole method of data collection, the biggest advantage being the reduction of errors due to routing or post-survey data entry.
Obviously, nothing can yet be said about the response rate. Several procedures have been introduced to raise response levels and diminish the effects of non response on data quality. The interviewers have received extended fieldwork training and improved work conditions. The main survey will be followed by a non response survey among those who refused to co-operate in the main survey and those who were absent after multiple calls. A short questionnaire dealing with some key items will be done in this group to see if their drug using behaviour differs systematically with the patterns found in the main survey.
The results of both characteristics of the response group and the non response group may lead to data manipulations such as weighting the survey results.
The implementation of the national survey means that finally, the Netherlands will have a decent source of data that serves multiple purposes among which the basic information for health care, prevention, education and drug policy. Hopefully, it is the beginning of a high quality drug research tradition.
References
EMCDDA (1996), Annual report on the state of the drugs problem in the European Union. Lisbon: EU.
Kuipers, S.B.M., C. Mensink, W.M. de Zwart (1993), Jeugd en riskant gedrag: roken, drinken, druggebruik en gokken onder scholieren vanaf 10 jaar. Utrecht: NIAD.
Sandwijk, J.P., P.D.A. Cohen, S. Musterd, M.P.S. Langemeijer (1995), Licit and illicit drug use in Amsterdam II. Report of a household survey in 1994 on the prevalence of drug use among the population of 12 years and over. Amsterdam: Universiteit van Amsterdam.
Schippers, G.M. & T.G. Broekman (1995) Alcohol, drugs and tobacco research 1993-1994, register of research in the Netherlands and Flanders on the use of alcohol, tobacco in 1993-1994, Buro Beta, Nijmegen.
Tweede Kamer der Staten Generaal (1995), Het Nederlandse Drugbeleid, continuïteit en verandering. Den Haag: SDU.
