Harrison, Lana D.,
Michael Backenheimer and James A. Inciardi (1995), Cannabis use in the
United States: Implications for policy. In: Peter Cohen & Arjan Sas
(Eds)(1996), Cannabisbeleid in Duitsland, Frankrijk en de Verenigde
Staten. Amsterdam, Centrum voor Drugsonderzoek, Universiteit van Amsterdam.
pp. 206-230.
© Copyright 1995, 1996 Centrum
voor Drugsonderzoek, Universiteit van Amsterdam. All rights reserved.
3 The nature and extent of marijuana use in the United States
Lana D. Harrison, Michael Backenheimer and James A. Inciardi
- Introduction
- Historical perspective
- The National Commission on Marihuana and Drug Abuse
- The National Household Survey on Drug Abuse
- The Monitoring the Future Survey
- The Drug Abuse Warning Network (Dawn)
- National Drug Abuse Treatment Utilization Survey
- Drug Use Forecasting (DUF)
- Marijuana arrests
- Criminal cases filed in U.S. district courts
- Drug use patterns among prison inmates
- Growth of corrections
- References
Introduction
The foundation of effective drug policy is research-based information that is current and is both valid and reliable. In any society in which drug use is viewed as an illegal activity and in which sanctions and penalties are associated with use, one of the best ways to understand the nature and extent of such use and understand the attitudes, beliefs, ideals and other correlates associated with its use is by carrying out confidential and anonymous national surveys. Such research studies have been ongoing in the United States for several decades. The purpose of this section is to draw upon such surveys to provide information on the patterns and trends of marijuana use in the United States. Data will not be reported from all national studies, but the findings from major surveys are discussed in some detail.
Historical perspective
The earliest survey data on marijuana use in the U.S. was obtained through a Gallup Poll in the spring of 1967. The nationally-based telephone poll of college students found a 5% lifetime prevalence of marijuana use. Two years later, this proportion jumped to 22%. A Gallup Poll of the adult population in the summer of 1969 found a 4% lifetime prevalence, with 12% of those in the 21-29 year old age group, 3% in the 30-49 year old group and only 1% of those aged 50 and over reporting ever trying marijuana. In the fall of 1970, another Gallup Poll of college students found 43% reported trying marijuana, with 39% reporting use in the past year and 28% reporting use in the past 30 days. By 1971, over half (51%) of the nation's college students reported lifetime use, and annual and thirty day prevalence rates stood at 41% and 30% respectively. These Gallup telephone polls document the explosion in marijuana use among college students during the late 1960s, with a leveling occurring in the early 1970s, such that by 1971, over half of the nation's college students had at least tried marijuana. It is commonly hypothesized that marijuana use first burgeoned among college students, and then spread to younger ages. A national survey of males in their finalyear of high school (aged 17-18 years) in 1969 found a 22% lifetime prevalence of use.
In 1970-1971, the New York Narcotic Addiction Control Commission conducted a major general population survey of New York State (Chambers and Inciardi, 1971). The research study used state-of-the-art techniques and, to that time, gave one of the best assessments (albeit limited to New York State) of the nature and extent of drug use. The study found that 12.3% of the New York State population had ever used marijuana. They further found that regular users (defined as at least 6 times per month) made up 3.5% (487,000 individuals) of the State's population. Of these regular users, over 70% were under the age of 25 and nearly half defined themselves as students at the high school or college levels.
The National Commission on Marihuana and Drug Abuse
The first national survey of drug use in the general population of the United States was conducted in 1971 under the auspices of the National Commission on Marihuana and Drug Abuse (the Shafer Commission). The study focused primarily on marijuana, since marijuana was the only illicit drug thought to be used by a significant number of people. Results from the survey showed 14% of youth aged 12-17, and 15% of adults aged 18 and older had tried marijuana. Use was clearly tied to age with 27% of 16-17 year olds, 40% of 18-21 year olds, 38% of 22-25 year olds, but only 6% of those aged 50 and older and of the 12-13 year olds having ever used the drug. Importantly, 41% of the adults and 45% of the youth reported they no longer used marijuana, and 9% of the adults and 15% of the youth reported they used less than once a month. Two percent of the adults and 4% of the youth who ever used marijuana reported using it several times a day.
A comprehensive national study of illicit drug use in 1972 by the Commission validated its belief that marijuana was the primary drug of use. Less than 5% of the United States population reported any experience with an illicit drug other than marijuana (hallucinogens, heroin, cocaine, stimulants, sedatives, tranquilizers, or inhalants). By age group, the 18-25 year olds reported the most drug experience, their use being about two to seven times higher than either older or younger groups. A startling 5% of junior high (generally 12-15 year olds), 11% of high school (generally 16-18 year olds), and 8% of college students (generally 18-22 year olds) reported daily cannabis use. Contrary to the media portrayal and popular opinion about the vast extent of marijuana and LSD use occurring among young people, the Commission concluded that 'the most widely used mood-altering drug in America is alcohol.' About half (53%) of the adults 18 years of age and older, and a quarter (24%) of youth (12-17 years old) had consumed alcoholic beverages in the week prior to the survey.
Data from these national surveys and other indicator data suggest there was virtually no marijuana use in the United States prior to the mid-1960's. 'Fewer than one million Americans had tried cannabis by 1965; by 1972, twenty-four million people had smoked marijuana at least once, eight million people were using it regularly, and at least half a million people were consuming it daily' (Slaughter, p. 420). Cannabis use is almost exclusively marijuana use rather than hashish use in the United States. Marijuana use burgeoned first, but a revolution in the technology and handling of other drugs was also blossoming. 'Recently compounded psychotropic agents were enthusiastically introduced and effectively promoted, with the consequence of exposing the national consciousness to an impressive catalogue of chemical temptations...' (Inciardi, 1981, p. 155). Concurrent with increases in marijuana use were increases in the use of most other classes of psychoactive drugs. Although the drug epidemic was initiated by youth and young adults and has continued to disproportionately affect youth, no age group has escaped its consequences.
From the data, it would appear that concern over the problem of youthful cannabis use as expressed in the early 1970s was justified. The Commission's national surveys served to place the problem of youthful drug use in perspective. These findings help underscore the value of survey data in gaining insight into hidden behaviors such as drug use. Only through the use of well designed and well executed surveys can a society come to gain a clear picture of drug use patterns as it exists within that society. The Commission's work was crucial to gaining a reliable and valid perception of drug use in the United States in the early 1970's.
The National Household Survey on Drug Abuse
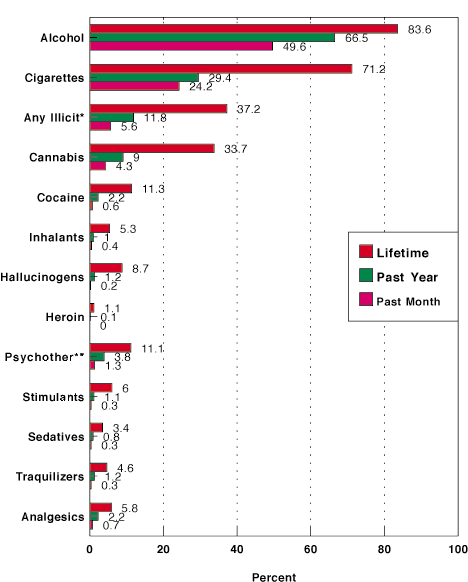
The National Household Survey on Drug Abuse grew out of the Marihuana Commission's national surveys and has been ongoing on an intermittent basis since 1974. It provides estimates of drug use among the household-based population, which constitutes 98% or more of the United States population. The Household Survey is a representative sample of the population in households aged 12 and older. Because the survey is conducted in homes rather than in schools, high school dropouts are included, but institutionalized persons (i.e., in hospitals and jails/prisons) and persons with no fixed address are omitted. (Some group quarters such as dormitories and homeless shelters were included beginning in 1991.) Due to the known variance in drug use prevalence by age, Household Survey results are generally presented for four discrete age groups: youth aged 12 to 17, young adults aged 18 to 25, middle adults aged 26 to 34, and older adults aged 35 and older. Data for 1993 are the latest available. Figure 1 shows the past year prevalence rates for various licit and illicit drugs in 1993 by age group.
 |
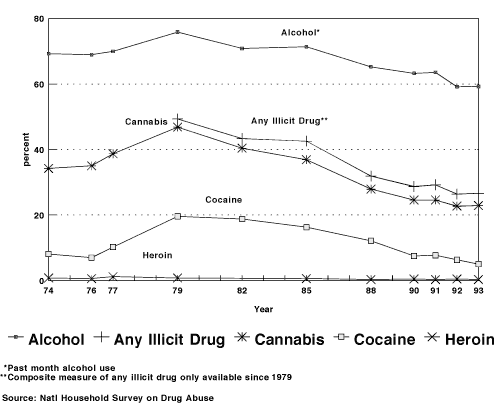
It is important to note that the Household Survey is not a longitudinal survey. However, there has been sufficient continuity in design and methodological procedures to allow computation of trend estimates from the repeated cross-sectional surveys. The trends in past year drug use among young adults are shown in Figure 2. Young adults, as previously mentioned, have the highest rates of drug use of any of the age groups. Among young adults, alcohol, cannabis, cocaine, and the summary measure of any illicit drug use all peaked around 1979.
 |
The 1993 Household Survey found 13.6% of youth, 26.6% of young adults, 17.4% of middle adults, and 6.3% of older adults reporting some illicit drug use in the past year. Alcohol had been used by 35.2% of youth, 79.0% of young adults, 81% of middle adults, and 64.6% of older adults. For 1993, marijuana/hashish is by far the most prevalent drug used by illicit drug users, as about 75-80% of current illicit drug users are marijuana/hashish users. An estimated 33.7% of the population (69,923,000) reported ever trying marijuana/hashish with 9% reporting use in the past year (18.6 million), and 4.3% reporting use in the past month (9.0 million). The prevalence of weekly marijuana/hashish use (over the past year) was 2.4% (about 5.1 million weekly users). It is worth noting that alcohol use far exceeded marijuana use at all prevalence points. After marijuana, the next most frequently reported class of drugs was non-medical use of psychotherapeutic drugs (including stimulants, sedatives, tranquilizers, and analgesics). This class had a 11% lifetime prevalence rate, a 3.8% annual prevalence rate, and a 1.3% past month prevalence rate. Use of a psychotherapeutic drug is reported more frequently than cocaine use. Young adults (those aged 18-25) are the most likely to use both licit and illicit drugs, followed by middle adults (26-34 years). Youth (ages 12-17) report the next highest rates followed by older adults (35 and older). This latter group, however, reports greater use of alcohol and tobacco than youth.
Both the Household and the Monitoring the Future national surveys show the same general trends in drug use. There was a peaking in overall rates of illicit drug use in the late 1970s, with gradual decreases through the early 1990s when rates stabilized. The surveys show a peaking of cannabis use in 1979 with the non-medical use of psychotherapeutics peaking in the early 1980s. The Household Survey shows that cigarette use has continually decreased among adults (18 years and older) since about 1979, but cigarette smoking has been relatively unchanged among youth (12-17 years old) since about 1979. Cocaine use peaked a few years later, in the early to mid-1980s. The later peak is due to use among older adults peaking several years later than it did among younger age groups.
Since 1993 there has been a stabilization to a reversal in the declining trends in marijuana use among youth. Marijuana use increased for the first time in the Monitoring the Future survey in 1993 and then again in 1994. The Household Survey has only released 1993 data. Marijuana use remained largely unchanged among all the groups with one exception. Youth aged 12-17 showed a significant increase in past year marijuana use, and although there were small increases in lifetime and past month rates, these did not reach statistical significance.
As stated earlier, data from both the Household and Monitoring the Future Surveys show marijuana to be, by far, the most prevalent drug used by illicit drug users. The Household Survey estimates that some 69 million Americans have tried marijuana. Following are specific data with respect to the demographics of use.
Age Group Differences: The highest lifetime prevalence is found among middle adults (59.2%), followed by young adults (47.4%), older adults (26.6%), and youth (11.7%). The ordering changes with respect to past year use which is highest among young adults (22.9%), followed by middle adults (13.8%), youth (10.1%), and then older adults (4.0%). The same ordering as found for past year marijuana use is repeated with past month rates with the highest prevalence among young adults (11.1%), followed by middle adults (6.7%), youth (4.9%), and older adults (1.9%). The same pattern by age grouping is found among weekly cannabis users.
Racial/Ethnic Differences: Whites (35.6%) report greater lifetime experience with cannabis than blacks (30.7%) or Hispanics (28.1%). However, blacks (10.4%) and Hispanics (9.6%) report greater past year prevalence rates than whites (8.8%). Past month prevalence rates are 4.2% white, 5.6% black, and 4.7% among Hispanics. Hispanic youth tend to report greater experience with marijuana than their same aged white and black peers, but white young adults report more past year and past month use than their Hispanic or black peers.
Gender Differences: Males consistently report higher prevalence rates than females across the lifetime (40.7% vs. 30.8%), past year (11.3% vs. 6.4%), and past month (5.9% vs. 2.7%) prevalence periods. These differences are apparent across the various age groups as well, although the gender differences among youth aged 12-17 are less pronounced.
Regional Variation: The West has consistently shown higher cannabis prevalence rates than the other regions of the country.
Population Density Variation: Although the nonmetropolitan areas have shown the lowest cannabis prevalence rates, the trend has been toward convergence such that currently, past year prevalence rates vary little by population density (e.g., large metro 9.3%, compared to 9.4% in small metro and 7.5% in nonmetro areas of the country). In the 1993 survey, more Hispanics in nonmetro areas report cannabis use than those residing in small or large metropolitan areas. Among blacks, those living in large metropolitan areas report greater cannabis use.
Frequency of Marijuana Use: Data from the 1992 Household Survey show that over a quarter of those who have used marijuana in their lifetimes, have used it 1-2 times. Similarly, about a quarter have used it 3-10 times. Another quarter of those who report any lifetime marijuana use report using it on a 100 or more occasions. Of those who have used marijuana in the past month, between 15% and 20% report use on 20 or more days.
Other Drug Use: Data from the 1992 Household Survey show that 90% of those who have used marijuana in the past month have also drank alcohol. About 63% have smoked cigarettes. About 25% of those who have used marijuana in the past month also report use of other illicit drugs, with about 12% reporting nonmedical use specifically of a psychotherapeutic drug. This pattern is found across the four age groups.
Dependence: Among past year marijuana users in 1992, about one in seven reported at least one problem attributed to marijuana use. Nearly a third reported at least one sign of dependence. The most frequently reported component of dependence among past year marijuana users was that they had tried to cut down (26.9%). An estimated 8.1% said they felt dependent on marijuana, and 6.9% said they needed larger amounts to get the same effect. Among those reporting past month use, 50.7% said they tried to cut down, 24.2% said they felt dependent, and 24.0% said they needed larger amounts to get the same effect.
Onset: The average age of onset of marijuana use in 1993 was 18.8 years. Among youth, the average age of initiation is 13.8 years, which is later than cigarettes (11.7), alcohol (13.0), inhalants (12.3), nonmedical use of a psychotherapeutic (13.0), and heroin (13.2).
Perceived Availability: A question in the Household Survey asks 'how difficult do you think it would be for you to get each of the following types of drugs, if you wanted some?' Marijuana was reported as 'fairly easy' to 'very easy' to obtain by 57.7% of the total population in 1993. This is significantly lower than the 62.1% of the population reporting marijuana as easy to obtain in 1991. Marijuana is reported as easier to obtain than any of the other illicit drugs. For example, 39% reported cocaine or crack were fairly or very easy to obtain, and 25.5% said the same about heroin. The percent reporting that marijuana was easy to get was highest among 18-25 year old (76.4%) and 26-34 year olds (69.5%). Just about half of both younger and older age groups reported marijuana was easy to obtain. Males reported greater ease in obtaining marijuana than females (62% vs. 54%), however for younger age groups, rates were similar for men and women. An estimated 64% of blacks, 58% of whites and 54% of Hispanics reported that marijuana was easy to get.
Risk of Harm: An estimated 44.6% of the population believed there was 'great harm' associated with smoking marijuana occasionally. Although this percentage increased from 41% in 1985 to 50% in 1988, it has been below 50% since then. The percentage associating great risk in 1993 was lowest among young adults (32.7%) and middle adults (29.3%) - who report the highest prevalence rates. The downward shift in perceived risk since 1988 is due to changes among older adults. Among those aged 39-53, the percent reporting great risk decreased from 51% in 1988 to 42% in 1992.
Consumption Estimate: The Office of National Drug Control Policy (ONDCP) undertook an estimate of total marijuana consumption in the United States based on data from three sources: the Household and Monitoring the Future Surveys, and the Drug Use Forecasting (DUF) Study. While the estimate is not without weakness, it does combine three distinct population bases (households, the young and those arrested) into a single figure. The table demonstrates a recurring trend that marijuana use, no matter how measured, appears to have been down in the period 1988-1992.
| 1988 | 1990 | 1991 | 1992 | |
|---|---|---|---|---|
| Households | 1871 | 1528 | 1326 | 1220 |
| College Students | 77 | 59 | ||
| Criminally Active | 375 | 363 | 358 | 279 |
| Total (in Gross Metric Tons) | 2322 | 1950 | 1694 | 1599 |
| Retail Cost (in Billions) | $16.6 | $15.5 | $13.5 | $13.1 |
The Monitoring the Future Survey
The Monitoring the Future (MTF) Survey is an annual survey of drug use among high school students in their last year of high school (generally aged 17-18). The survey has been conducted since 1975 by the Institute for Social Research at the University of Michigan. In recognition of the need for national data to track changes in drug use and related attitudes and behaviors of American youth, a group often on the cutting edge of societal change, it has been supported by a series of research grants from the National Institute on Drug Abuse (NIDA). Sample sizes have ranged between 15,000 and 19,000. In 1994, approximately 16,000 students made up the sample of students in their last year of high school. This sample was located in 139 public and private high schools throughout the United States and is representative of students in their final year of high school in the coterminous United States. The seniors filled out self-administered questionnaires given to them in their classrooms by University of Michigan personnel.
The survey was expanded in 1991 to include representative samples of eighth (generally 13-14 year olds) and tenth-graders (generally 15-16 year olds). For 1994, 18,000 students comprised the eighth grade sample in 150 schools and 16,000 students in 130 schools comprised the tenth grade sample. In total, about 50,000 students in about 420 public and private schools are now part of the annual survey. The primary data reported from MTF are drug use prevalence, perceptions regarding the availability of drugs, and attitudes and beliefs about the risks and level of disapproval of drug use.
Data from MTF are reasonably consistent in showing a general decline in marijuana use during the period 1979-1992. This is so regardless of what prevalence measure is chosen; regardless of whether past month use (usually referred to as current use), past year use or lifetime use is considered. However, several recent findings from MTF give reason for concern with respect to marijuana use. After declining steadily since the peak prevalence years of the late 1970's, past month, past year use, and lifetime use of marijuana by 17-18 year old high school students increased in both 1993 and 1994. Past month prevalence rates increased from 11.9% in 1992 to 15.5% in 1993 to 19.0% in 1994, an increase of nearly 60% in two years. Marijuana use in the year prior to survey went from 21.9% in 1992 to 26.0% in 1993 to 30.7% in 1994, an increase of over 40% in a two year period. When lifetime prevalence is considered, the rate of marijuana use went from 32.6% in 1992 to 35.3% in 1993 to 38.2% in 1994, a 17% increase in the two year period. The cited prevalence figures for the use of marijuana by 17-18 year old high school students in no way approaches the peak prevalence year of 1979 or the rates (lifetime) in excess of 40% noted in the period 1975 through 1985; nevertheless the reported prevalence for 1994 does approach or exceed the 1988 rates; a definite signal that prevalence is on the increase.
The picture for younger youth, 13-14 and 15-16 year old students, also shows recent increases in use. Considering past month use, 13-14 year olds showed a rate of 3.7% in 1992, 5.1% in 1993 and 7.8% in 1994, over a 100% increase in the two year period. For 15-16 year old students the figures are 8.1% in 1992, 10.9% in 1993 and 15.8% in 1994, a 95% increase in the same two year period. Considering annual use does little to change this picture. In 1992, 7.2% of 13-14 year old students had used marijuana in the year prior to survey. This figure increases to 9.2% in 1993 and 13.0% in 1994, an 80% increase in the two year period. For 15-16 year old students, the 1992-1994 percentages are 15.2%, 19.2% and 25.2% respectively, an increase of 66% in the cited period. Lifetime prevalence (ever used) of marijuana use for 13-14 year old students in the period 1992-1994 shows percentages of 11.2%, 12.6% and 16.7%, just under a 50% increase for the referenced time frame. For 15-16 year old students, the 1992-1994 time frame shows percentages of 21.4%, 24.4% and 30.4%, an increase of 42% for the two year period.
While some of the cited increases from year-to-year, it is important to view the data in the aggregate. Every group of students showed an increase in every year by every category of use. When 1992 is used as baseline, the percentages of increase are substantial. Further, for the 17-18 year old students, the rates in general can be said to be approaching or surpassing the 1988 figures.
As another indicator of marijuana trend we looked at the students' perceptions of harmfulness (1) if marijuana is tried once or twice, (2) if marijuana is smoked on an occasional basis and (3) if marijuana is smoked regularly. Each measure will be briefly discussed by individual grade.
Among 17-18 year old students in 1992, 24.5% perceived great risk of harm in trying marijuana once or twice. For 1993 this percentage decreases to 21.9% and decreases still further to 19.5% in 1994. There was thus a drop of 5 percentage points (20% overall) in the two year period. Considering the occasional smoking of marijuana, 39.6% of the 17-18 year old students in 1992 perceived great harm. In 1993 the percentage dropped to 35.6% and then dropped to 30.1% in 1994. This represents a drop of 9.5 percentage points (24%) in the two year period. When the regular smoking of marijuana is reviewed in terms of perceived harm, 76.5% of 17-18 year old students saw it as posing great harm in 1992. This percentage dropped to 72.5% in 1993 and fell to 65.0% in 1994. Overall, this is a decline in perceived harmfulness of 11.5%, a 15% decline in the referenced period. Long term trends show the percentage of 17-18 year old students attributing great risk of harm to marijuana use peaked in 1991, and has been gradually falling.
Looking at 13-14 year old students yields much the same results regardless of what measure of use is considered. In 1992, 39.1% of 13-14 year old students felt trying marijuana once or twice was harmful. For 1993 this drops to 36.2% and drops still further for 1994 to 31.6%; a decline of 7.5% (19%) for the two year time frame. When the occasional smoking of marijuana is considered, the 1992 base of perceived harmfulness is 56.3%. This declines in 1993 to 53.8% and to 48.6% in 1994. There is thus a drop of 7.7% in the two year period amounting to a loss of nearly 14% when the loss is seen in terms of the 1992 base. In 1992, 82.0% of the 13-14 year old students saw harm in the regular smoking of marijuana. For 1993 there is a drop to 79.6% with 1994 exhibiting a further drop to 74.3%; overall a drop of 7.7 percentage points with the decline being 9% of the 1992 figure.
Data from the sample of 15-16 year old students are very much in keeping with those trends already noted for 13-14 and 17-18 year old students. Some 31.9% of the 15-16 year old students in 1992 perceived great harm in trying marijuana once or twice. In 1993 this percentage was 29.7% and in 1994 it was 24.4%, altogether a drop of 7.2% over the two year period but a dropoff of over 22% from the 1992 base. When marijuana is smoked occasionally, great harm is perceived by 48.9% of the 1992 15-16 year old students. These figures go down to 46.1% in 1993 and 38.9% in 1994. Thus there was a decline of 10 percentage points in the two year period and a loss of 20% when the 10 points are viewed as a percentage of the 1992 base. For the final measure, smoking marijuana regularly, some 81.1% of the 1992 15-16 year old students perceived harm. In 1993 this percentage was 78.5% and in 1994 it was 71.3%. The two year loss was thus 9.8% or 12% when viewed as a percentage of 1992 base.
The data were also reviewed with respect to social disapproval of people who (1) try marijuana once or twice (2) smoke marijuana occasionally and (3) smoke marijuana regularly. Again, 8th (13-14 years old on average), 10th (15-16 years old on average), and 12th grade (17-18 years on average) students were the subgroups looked at. The findings are as follows:
The long term trends among 17-18 year old students show 'disapproval of people who smoke marijuana occasionally' or 'regularly,' peaking in 1990, although disapproval of people trying 'marijuana once or twice' did not peak until 1992. In 1992, 69.9% of the 12th graders said they disapproved of people who try marijuana once or twice. For 1993, this figure declines to 63.3% and goes down to 57.6% in 1994. There is thus a loss of 12.3% in the two year period and a decline of nearly 18% when the loss is used as numerator against the 1992 base of 69.9%. Among 17-18 year old students in 1992, 79.7% said they disapproved of people who smoke marijuana occasionally. In 1993 the percentage was 75.5% and in 1994 it was 68.9%. This loss of 10.8 percentage points is over a 13% drop when the 1992 figure is used as base. Disapproval of those who smoke marijuana regularly was 90.1% in 1992 but decreased to 87.6% in 1993 and went down to 82.3% in 1994. The two year loss is thus 7.8% and the decline with 1992 as denominator is nearly 9%.
Turning to the 13-14 year old students with respect to disapproval ratings, the same trends are easily noted. In 1992, 82.1% of 13-14 year old students disapproved of people who try marijuana once or twice. For 1993, the percentage declines to 79.2% and goes down, in 1994, to 72.9%. Overall, this is a loss of 9.2% and a drop of 11% as a portion of the 1992 base. When occasional smoking of marijuana is reviewed, the rates of disapproval are 88.1% in 1992, 85.7% in 1993 and 80.9% in 1994; a loss of 7.2% in two years and a drop of just over 8% when the loss is employed as a portion of the 1992 base. In 1992, 90.8% of the 13-14 year old students disapproved of those who smoke marijuana regularly. This drops to 88.9% in 1993 and 85.3% in 1994. A loss of 5.5% is noted over the two year period with a drop from the 1992 base of 6%.
The 15-16 year old students continue the trends already cited. In 1992 some 74.8% disapproved of people who try marijuana once or twice. This percentage dropped to 70.3% in 1993 and then to 62.4% in 1994. There was thus a decrease of 12.4% in the two year period. When this loss is viewed as a proportion of the 1992 base, the percentage loss is over 16%. In terms of disapproval of smoking marijuana occasionally, the 15-16 year old students went from a disapproval rating of 83.6% in 1992 to 79.4% in 1993 to 72.3% in 1994. The last category, smoking marijuana regularly, brought a disapproval rating of 90.0% in 1992, 87.4% in 1993 and 82.2% in 1994; a decrease of 7.8% in the two year period and a drop of nearly 9% when the loss is seen as a proportion of the 1992 base.
The MTF survey has documented that shifts in attitudes about the perceived risks associated with the use of marijuana preceded the downward trend in marijuana use (Bachman et al., 1988). Perceived harm and risk in MTF survey seem to lead prevalence rates by at least a year. When perceived harm and risk go up, prevalence rates the following year tend to decrease; when perceived harm and risk go down, prevalence rates the following year go up.
As a final measure of change since 1992, we examined perceived availability of marijuana. Looking first at the youngest in the MTF, the 13-14 year old students, 42.3% felt, in 1992, that marijuana was 'fairly easy' or 'very easy' to get. In 1993 this had gone up slightly to 43.8% but in 1994 it rose dramatically to 49.9% (about one out of two 13-14 year olds responding that marijuana is 'fairly easy' or 'very easy' to obtain). Between 1992 and 1994 the rise is 7.6% and an increase of about 18% over the 1992 base. For the 15-16 year old students, 65.2% in 1992 believed marijuana 'fairly easy' or 'very easy' to get. For 1993 this figure was 68.4% with a large increase to 75.0% noted in 1994. The rise for the two year period is a remarkable 9.8% and the increase over the 1992 base is 15%. Of the 17-18 year olds students in 1992, 82.7% perceived marijuana to be 'fairly easy' to 'very easy' to get. The 1993 and 1994 figures are 83.0% and 85.5%. Thus there is an increase of only 2.8% in the two year period and a 3.4% increase over the 1992 base. Nevertheless, when 85.5% of 17-18 year old students believe an illegal substance is fairly to very easy to obtain there, at a minimum, should be pause for thought.
MTF trend data suggest that the recent increase in the use of certain drug measures is not restricted to particular groups or geographic areas. Detailed data are not yet available for 1994, thus we must resort to looking at data from 1992 to 1993. The increase of past year use of marijuana by seniors was true in the northeastern, north central, and southern states; only students in the western states did not show this increase. From 1992 to 1993, the increase in seniors past year use of marijuana/hashish occurred at schools in large metropolitan areas, other metropolitan areas, and outside metropolitan areas. Data on past year use according to race/ethnicity showed increases from 1992 to 1993 for black and white seniors but no comparable increase for Hispanic seniors. The 1992 to 1993 increase in seniors past marijuana use was observed in each social class.
The picture painted by data from MTF shows dramatic internal consistency in pointing to a rise in marijuana use by the youth of the United States. No matter which measure of prevalence is used - lifetime, annual or current - and no matter which grade is considered -the 8th, 10th or 12th - the data are consistent. Validation is provided these rates by a drop in the perceived harm of marijuana by youth, by a drop in their disapproval of three marijuana smoking behaviors (trying marijuana, occasional use, and regular use) and by an increase in the perceived availability of marijuana, particularly within the 8th and 10th grades. This turnaround since 1992 is not yet of the magnitude of prevalence noted in 1979 and surrounding years, but it is worth noting that these data indicate we have returned to 1988 levels of prevalence.
A two year reversal in trend does not necessarily mean we have turned the corner on the decade-long decrease in students' drug use and are now headed for another drug era. Confirmatory data from other sources and another year's data from MTF and the Household Surveys are critical to clarifying the picture.
The Drug Abuse Warning Network (Dawn)
The Household Survey and MTF are both national surveys that obtain prevalence data on drug use from the general, so-called normal, national and nonclinical populations. There are, however, also surveys which are national in scope which deal with selected populations -- often populations who could be said to suffer some consequences from their drug use. One such survey is the Drug Abuse Warning Network (DAWN). It is the oldest national epidemiological drug survey, having tracked the number of drug-related emergency room episodes and drug-related deaths since the early 1970s. Both the sample of emergency rooms and the sample of medical examiners were originally designed to be national in coverage, but both experienced attrition in sample members and difficulties in maintaining the nationally representation sample over the years. However, the emergency room sample was redesigned in 1989 to again be nationally representative. DAWN and the Household Surveys were transferred to the Substance Abuse and Mental Health Services Administration (SAMHSA) at their creation in 1992. The current emergency room sample is composed of 600 reporting units and is designed to provide self-representing estimates of drug related emergency room episodes nationally, and for 27 major metropolitan areas in the coterminous United States.
Data are gathered by DAWN staff reviewing hospital emergency room (ER) medical records for drug mentions. The patient - and/or those accompanying them - frequently self-report whether the use of any drug(s) precipitated their visit. Medical tests may also be used to determine a drug related ER incident. Each drug mention is recorded separately, as well as in combination with other drugs (except alcohol, which is always reported in combination with other drugs). Each drug mention contributes to the overall trends for the individual drugs, even though many episodes involve multiple drug mentions.
In discussing marijuana as a factor in emergency room episodes it is critical to bear in mind that marijuana is often mentioned in combination with other drugs, particularly alcohol and cocaine (SAMHSA, 1993b). The marijuana use itself may not contribute to the emergency room episode, but rather the drug(s) it is used with in combination. Alternatively, the combination of marijuana with other drug(s) may produce a synergistic effect leading to increased health consequences. For 1993, DAWN estimated 29,166 emergency room mentions of marijuana. Of these, half also involved alcohol, and 40% also involved cocaine. Twenty percent of the marijuana episodes mentioned marijuana alone.
Data from DAWN emergency room episodes are available through 1993. Marijuana trends are available for the 6 year period 1988 through 1993 from the national sample (SAMHSA, 1994). In 1988 there were 19,963 emergency room mentions involving marijuana. In 1989 there was a slight increase to 20,703. This number went down in both 1990 and 1991 but rose dramatically in 1992 to 23,998 mentions, and then again in 1993 to 29,166 mentions. The 1993 figure represents a 21% increase over the 1992 total and a 46% increase over the 1988 number. The most common reason for the contact with the emergency room was 'unexpected reaction.' In 1992 and 1993, about 31% of the contacts gave this reason. Importantly, however, some 24% of the contacts in 1992 and 19% in 1993 gave 'seeking detoxification' as their reason for contact. Also of importance is the fact that over 37% of the mentions in both 1992 and 1993 gave 'dependence' as a drug use motive but only 25% in those same years gave 'recreational use' as a motive. These differences and percentages are relatively stable across the examined six year time span.
Considered according to demographic characteristics, the number of marijuana-related episodes involving males increased from 13,852 in 1988 to 20,368 in 1993, a 47% increase in the five year period. Episodes involving females went from 6,031 in 1988 to 8,525 in 1993, a 41% increase in the same time frame. By race, episodes involving whites increased from 9,717 in 1988 to 13,759 in 1993, an increase of 42%. Blacks showed an increase in episodes from 6,527 in 1988 to 10,167 in 1993, an increase of 56%. Hispanics had 1,513 episodes in 1988 and this increased to 2,631 in 1993, a 74% increase but a decrease of 6% from the 1992 episode figure. Between 1988 and 1993, emergency room episodes involving 18-25 year olds constituted the majority of episodes (8,150 or 41% in 1988 and 9,655 or 33% in 1993), the rise in episodes over 1988 constituting an 18% rise in the five year period for this age group. In the 26 through 34 year old group, episodes rose from 6,442 in 1988 to 9,342 in 1993, a 45% increase in the five year period. Episodes among the 35 and older were 2,350 (22% of all episodes) in 1988 and increased dramatically to 5,689 (19.5% of all episodes but a 142% increase since 1988.
Medical examiner data on drug-related deaths are collected from medical examiner offices in 27 major metropolitan areas. In the medical examiner component of the DAWN study, toxicology reports are available in virtually all cases to determine drug related deaths. As with the ER component of the study, each drug mention is recorded separately, as well as in combination with other drugs (except alcohol, which is always reported in combination with other drugs). Each drug mention contributes to the overall trends for the individual drugs, even though many episodes involve multiple drug mentions. Since 1985, the data show an increase in cocaine related deaths from 717 to 3910 in 1993 (a 450% increase), and for heroin/morphine related deaths from 1433 to 3805 (a 165% increase). There is more stability in the number of marijuana-related deaths, ranging from a low of 105 to a high of 209 between 1985 and 1992. However, 457 deaths in which marijuana was found in the body were recorded in 1993. Therefore, these medical examiner data loosely parallel the emergency room data for cocaine and heroin/morphine, but diverge for marijuana.
National Drug Abuse Treatment Utilization Survey
Good quality, systematic data on treatment admissions are not compiled in the U.S. The best source of such information, the National Drug and Alcoholism Treatment Unit Survey (NDATUS), is a voluntary reporting system. Major changes in the reporting criteria system in the early 1980s created problems for the system, so trends are not reliable. Nevertheless, since they are the best data available, they are reported herein, but caution is urged in interpreting the data. The facilities that report include both in-patient and out-patient programs, as well as detoxification programs.
The following table shows the trends in client treatment admissions to State-supported facilities for the top three primary drugs of abuse in the period 1987 through 1992--heroin, cocaine, and marijuana/hashish. Like the DAWN study, clients may report more than one drug of abuse; thus, particularly in the case of marijuana, it is important to bear in mind that alcohol or some other drug is almost always associated with it. Admissions for heroin, cocaine, and marijuana/hashish, have all risen since 1987. Cocaine treatment admissions, in particular, have risen dramatically from 81,356 admissions in 1987 to 289,644 in 1992, a 256% increase in just six years. The increase in treatment cases in which marijuana is mentioned as a primary drug of abuse is also noteworthy. In 1987, 57,473 individuals were admitted to treatment who reported marijuana as one of their top three primary drugs of abuse. This rose to 94,685 in 1992, an increase of nearly 65% in the six year period. (In 1992, a total of 97,964 marijuana admissions were reported by all States, Guam, Puerto Rico and the District of Columbia. In 13 States, marijuana was the primary drug of abuse related to treatment admissions. The data in the cited table are based on data from 43 States, the District of Columbia, and Puerto Rico.)
| Fiscal Year | Heroin | Cocaine | Marijuana/Hashish |
|---|---|---|---|
| 1987 | 94,299 | 81,356 | 57,473 |
| 1988 | 115,308 | 137,343 | 76,948 |
| 1989 | 122,612 | 206,480 | 95,253 |
| 1990 | 153,852 | 235,202 | 106,885 |
| 1991 | 142,372 | 229,703 | 96,421 |
| 1992 | 128,044 | 289,644 | 94,685 |
The Office of National Drug Control Policy (ONDCP) compiled data on treatment based upon a sample of treatment providers from NDATUS. Fifteen programs from each of the four NDATUS regions made up the data base and each region was represented about equally in terms of percentage of programs (the range being 22-30%). In November, 1994 this survey found that marijuana was the primary drug of abuse for 12-22% of program clientele across the country. In three of the four regions, the percentage of clients entering treatment for marijuana exceeded the percentage for heroin. Only in Region I, essentially the northeast United States, was this not the case. It is, however, critical to note that in almost every case of treatment admission for marijuana, some other substance (or substances) is involved. In the vast majority of marijuana presentations, alcohol is involved (69% to 92% depending on region) with cocaine being a distant second (ONDCP, 1994, p. 11). Thus the issue of comorbidity is paramount when speaking of marijuana in the treatment context.
In the State of Maryland where each client entering a treatment facility may report up to three substances of abuse as problems at the time of admission, there was a decline in juveniles presenting for marijuana abuse from 1990 through 1992, but there was an increase in 1993 and 1994 (Center for Substance Abuse Research, 1995). For the year 1990, 64% of juvenile clients cited marijuana as a problem. This decreased to 53% in 1991 and 47% in 1992 but increased to 55% in 1993 and 70% in 1994. Marijuana was second only to alcohol in each of the cited years with alcohol cited as a problem in 81% of the cases in 1994. These data support the thesis that marijuana use cannot be discounted in the treatment context but that the issue of comorbidity, as already stated, must be a prime consideration in devising treatment and prevention strategies.
Drug Use Forecasting (DUF)
Another survey, national in scope, but dealing with a selected criminal justice population is the Drug Use Forecasting (DUF) sponsored by the National Institute of Justice (NIJ). DUF surveys drug use among arrestees that have been formally booked and charged in central booking facilities in major cities throughout the United States. This study differs from most other drug studies in its use of urinalysis to measure recent drug use. Urinalysis can generally detect drug use in the past two to three days. The study also uses self-report methods to obtain information on lifetime, past year, and past month drug and alcohol use. The DUF study has been conducted in 23 major cities in the USA since 1988. New samples of arrestees are interviewed quarterly in each of the participating cities. Since the pilot study demonstrated a higher rate of drug use among offenders arrested on drug charges, the DUF project tries to keep the number of participants in this category to no more than a quarter of the city samples. Due to their comparatively smaller numbers, all females, regardless of charge, are asked to participate in the study. The DUF study is essentially a convenience sample of arrestees, and primarily includes those charged with serious felony offenses. The DUF study is not generalizable to the broader population of arrestees in each city, or nationally.
All in all, the DUF study has demonstrated a very high rate of drug use among felony arrestees in major U.S. cities, but there is not a readily discernable pattern. Slightly higher prevalence rates are consistently found in a few cities like Manhattan, Chicago, and San Diego, and lower rates in Portland and Omaha. Cocaine has been the most frequently detected drug by a large margin. There was little change in the numbers testing positive for at least one illicit drug among the combined city samples of males and females from 1988 to 1992, although there are fluctuations in basic prevalence measures (Center for Substance Abuse Research, 1993). Cocaine use has increased in some cities and decreased in others, but the general pattern is one of stability. Opiate use has been stable to decreasing since 1988 (NIJ, 1993). Following a slow, but steady decline between 1988 and 1991, marijuana use began to rise (NIJ, 1994). Marijuana use is highest among young adults and juveniles (Chalsma and Boyum, 1994).
Using a weighted average based on the number of reported crimes in each city, Chalsma and Boyum (1994) combined the data across the 23 sites for the years 1988 through 1992. The percentage of males testing positive for cannabis dropped from about 33% in 1988 to 20% in 1991. Rates started to increase and in 1992, about 25% of males tested positive for cannabis. A similar trend is found among females, although the percentage who test positive is only about two-thirds of that of males. For example, about 19% of females tested positive for cannabis in 1988, and 12% in 1992. Data from 1993 show marijuana use continuing to rise among adult male arrestees. The percentage of male arrestees testing positive for marijuana equalled or surpassed that for cocaine in seven DUF sites (CESAR, 1995).
Marijuana arrests
Federal, State and local law enforcement agencies share responsibility for enforcing the nation's drug laws though the majority of drug arrests are made by State and local authorities. However, the Drug Enforcement Administration (DEA) and the Federal Bureau of Investigation (FBI) also make arrests at the Federal level. For drug violations involving smuggling, the U.S. Coast Guard and U.S. Customs Service are also responsible for carrying out drug laws. Due to variations in the ways the separate states collect information, data is not combined to yield national totals, however the FBI estimates the number of arrests for drug violations by State and local police.
There were less than 30,000 arrests for drug offenses in 1960 (Califano, 1995, p. 40). The same year, 169 federal marijuana violations were recorded (Solomon, 1966). In 1965, one source puts the number of annual arrests for all marijuana offenses, both possession and trafficking, by all law enforcement officials in the United States at about 20,000. By 1970 this figure had increased dramatically to 190,000 and then rose at an even faster rate to 421,000 in 1973. This figure increased to 446,000 in 1974 and stayed above 400,000 into the mid 1980s (Slaughter, 1988, pp. 421 and 424).
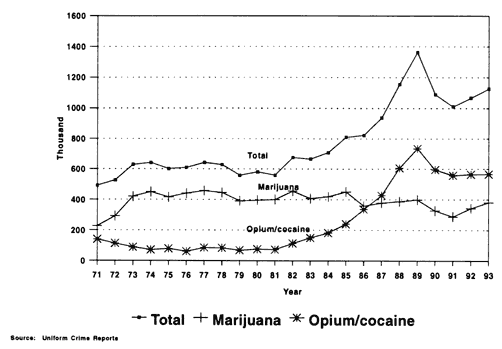
Between 1980 and 1993, the number of arrests for drug offenses by State and local police doubled from 580,901 to 1,126,300 (Uniform Crime Reports, 1994). Whereas the 1980 total was dominated by arrests for marijuana (70%) and possession offenses (82%), by 1992, the distribution of heroin/cocaine related arrests (53%) exceeded the number for marijuana (32.1%), although distribution arrests accounted for about equivalent shares in 1980 (27%) and 1992 (27.2%) (cf., Maguire and Pastore, 1994). Overall, drug arrests began their rapid escalation in ernest after 1983. Figure 3 shows that following a big jump between 1971 and 1973, arrests for marijuana remained relatively stable until 1985, dropped in 1986, but then, with the exception of a downturn in 1990, have shown a gradual rise. State and Local level arrests generally constitute so-called 'low level' cases. Smaller quantitites of marijuana are involved, not the larger amounts generally involving Federal offenses. Of 893,630 estimated felony convictions in State courts in 1992, only 16,376, 1.8% involved marijuana (BJS, 1995, p.2). The trend had been toward an increase in the numbers arrested for sales and distribution over the period, but 1992 signalled a bit of a reversal in the trend.
 |
Looking at the recent trends in drug arrests, the following table shows there were approximately 1.1 million arrests for drug offenses in 1990. Of this number, 66,500 (6.1%) were for sale/manufacture of marijuana and 260,400 (23.9%) were for possession for a total of 326,900 cases (30%). For 1991, there were approximately 1.0 million arrests for drug offenses. Of this number 6l,610 (6.1%) were for sale/manufacture of marijuana and 226,240 (22.4%) were for possession for a total of 287,850 (28.5%). In 1992 there were 342,314 arrests for drug law violations involving marijuana. This was 32.1% of all arrests for all drug law violations (1.1 million persons). Of the marijuana arrests, 70,382 (6.6%) were for sale/manufacture and 271,932 (25.5%) were for possession. In 1993, there were 380,690 arrests for marijuana. This was 33.8% of all drug arrests. Approximately 6.2% of the marijuana arrests were for sale/manufacture (69,831), and 27.6% were for possession (310,859). (Communication from Wayne J. Roques, DEA; Maguire and Pastore, 1994; Uniform Crime Reports, 1994).
| Year | Number of Persons Arrested for Drug Offences | Number Arrested for Marijuana Sales/Distribution | Number Arrested for Marijuana Possession | Total Marijuana Arrests |
|---|---|---|---|---|
| 1990 | 1,089,500 | 66,460 6.1% |
260,390 23.9% |
326,850 30.0%* |
| 1991 | 1,010,000 | 61,610 6.1% |
226,240 22.4% |
287,850 28.5%* |
| 1992 | 1,066,400 | 70,382 6.6% |
271,932 25.5% |
341,314 32.1%* |
| 1993 | 1,126,300 | 69,831 6.2% |
310,859 27.6% |
380,690 33.8%* |
|
* Percent of marijuana arrests as a function of
total drug arrests.
|
||||
Overall, drug arrests began their rapid escalation after 1983. The trend had been toward an increase in the numbers arrested for sales and distribution over the period, but 1992 signalled a bit of a reversal in the trend. The increase in drug arrests since 1983 is almost entirely attributable to the increase in arrests for opium and cocaine, and not marijuana. After reaching their high point in 1982 at 455,900, arrests for marijuana stabilized through about 1985. Marijuana related arrests decreased by nearly a quarter between 1985 and 1986, when they started to rise again. They fell again by about a third in 1990, and are again on the rise.
Criminal cases filed in U.S. district courts
Records have been compiled on the number of federal defendants charged with drug law violations in U.S. District Courts for several decades. The federal court system handles cases typically against higher level drug dealers and their agents. Between 1945 and 1968, the numbers were relatively stable. The number of drug offenders gradually increased from 1968 through 1974, when they stabilized and started to decrease. That decrease ended in 1980. The following table shows that over the period 1980-1992, there was a 346% increase in the number of federal defendants sentenced to prison in U.S. District Courts for drug offenses, compared to a 71% increase for non-drug offenses (BJS, 1992). A study commissioned by Attorney General Janet Reno in 1993 concluded that more than one-fifth of the federal prison population consists of 'low-level' drug offenders, defined as persons convicted of drug crimes who have no prior prison time, no current or prior violence in their records, and no involvement in sophisticated criminal activity (CJN Drug Letter, 1994).
| Defendants | 1980 | 1985 | 1986 | 1987 | 1988 | 1989 | 1990 | 1991 | 1992 | Change 80-92* |
|---|---|---|---|---|---|---|---|---|---|---|
| Non-Drug Offenses | 32,053 | 38,259 | 39,406 | 38,182 | 37,488 | 38,211 | 39,472 | 38,990 | 39,586 | 24% |
| Drug Offenses | 7,119 | 12,984 | 14,746 | 16,443 | 16,710 | 19,750 | 20,035 | 21,203 | 22,277 | 213% |
| Total | 39,172 | 51,243 | 54,152 | 54,625 | 54,198 | 57,672 | 60,499 | 60,193 | 61,863 | 58% |
| Defendants Sentenced to Prison | ||||||||||
| Non-Drug Offenses | 10,091 | 12,831 | 13,786 | 13,383 | 12,851 | 14,071 | 15,676 | 15,543 | 17,221 | 71% |
| Drug Offenses | 3,675 | 7,774 | 9,272 | 10,196 | 10,599 | 13,306 | 14,092 | 15,012 | 16,401 | 346% |
| Total | 13,766 | 20,605 | 23,058 | 23,579 | 23,450 | 27,377 | 28,659 | 30,555 | 33,622 | 144% |
| Average Sentence Length in Months | ||||||||||
| All Offenses | 44.3 | 50.7 | 52.7 | 55.2 | 55.1 | 54.5 | 57.2 | 61.9 | 62.2 | 41% |
| Drug Offenses | 47.1 | 58.2 | 62.2 | 67.8 | 71.3 | 74.9 | 80.9 | 84.7 | 82.2 | 75% |
|
* Preliminary data for 1992.
Source: Bureau of Justice Statistics, 1992. |
||||||||||
In 1991, 46,337 criminal cases were filed in U.S. District Courts. In 1992, this figure rose 2.4% to 47,472. Drug law violations constituted 11,954 cases (about 26% of the total) and increased 7.4% to 12,833 in 1992 (about 27% of the total). Marijuana cases numbered 3,488 in 1991 (about 29% of all drug law violation cases and 7.5% of all cases) and in 1992 increased 16.8% to 4,073 cases (about 32% of all drug law violations cases and 8.6% of all cases) (Maguire and Pastore, 1994, p. 499).
Some 77% of the defendants charged in U.S. District Court in 1985 with a marijuana violation were convicted. The percentage convicted has risen steadily over the intervening years, reaching 85% in 1991 and 86% in 1992 (Maguire and Pastore, 1994, p. 512). Of those marijuana defendants convicted in U.S. District Courts in 1985, 67% received prison time. As with convictions, the percentage of those receiving a prison sentence has risen steadily over the intervening years, reaching 79% in 1991 and 81% in 1992 (Maguire and Pastore, 1994, p. 512). Somewhat surprisingly, the average length of prison sentence among those convicted of a marijuana violation in U.S. District Courts remained relatively unchanged in the period 1985 through 1992, in spite of mandatory minimum statutes. In 1985, the average length of sentence was 46 months; in 1992 the figure was exactly the same, 46 months. The intervening time period saw average length of sentences range between 47 and 51 months (Maguire and Pastore, 1994, p. 513). It would seem that though the numbers charged, convicted, and receiving prison sentences are increasing for marijuana violations, the length of prison term is not increasing.
We also reviewed what happened to defendants in U.S. District Courts for the year 1992 with respect to disposition of case. In that year there were 5,657 marijuana defendants before the court. Of that number 917 (16%) were not convicted with 814 of these being dismissed by the court. Of the remaining 103 defendants, 15 were acquitted by the court and 88 were acquitted by jury. Turning to the 4,740 defendants convicted by the judge, the vast majority, 4,283 entered a plea of guilty. Two defendants pled nolo contendere, 34 were convicted by the court and 421 were convicted by jury (Maguire and Pastore, 1994, p. 523).
Drug use patterns among prison inmates
Inmates in Federal prisons in 1991 were far more likely than those in State prisons to be incarcerated for a drug offense(s). Some 57.9% of all Federal inmates were serving time for a drug offense. For State inmates this figure drops to 21.3% (Bureau of Justice Statistics, 1994b). Yet, Federal prisoners were far less likely than State prisoners to report using drugs, including marijuana. In 1991, 52.8% of the Federal prisoners said they had ever used marijuana. At the State level this figure is 73.8%. With respect to ever having used marijuana on a regular basis, 32.2% of the Federal and 51.9% of the State inmates replied in the affirmative. When asked about the use of marijuana in the month before the offense, 19.2% of the Federal and 32.2% of the State prisoners replied positively. In terms of using marijuana at the time of the offense, 5.9% of the Federal and 11.4% of the State inmates said they had been under the influence of marijuana at the time they committed the offense leading to their incarceration. Of all drugs (alcohol was not included), marijuana was the substance most common to both groups of prisoners, followed by cocaine and then heroin (BJS, 1994b).
Among Federal inmates for the year 1991, it is possible to obtain a measure of the amount of drugs involved for the current offense. For those involved in marijuana trafficking (4,420 inmates), the median number of grams involved was 136,080 (in excess of 272 pounds) and the mean number of grams was 3,353,580 grams (over 6,700 pounds). For those inmates convicted of marijuana possession (1,506 inmates), the median number of grams involved in the offense was 45,360 (over 90 pounds) and the mean number of grams was 2,100,560 (over 4200 pounds). (The Drug Enforcement Administration estimates a pound of marijuana as having a value somewhere between $400 and $3,000 (BJS, 1994b).) Unfortunately these data are not available for State inmates.
Growth of corrections
In general, the nation's resolve to 'get tough' on drugs has impacted on all levels of the criminal justice system. One of the most dramatic and costly effects has been the enormous increase in jail and prison populations over the past few years (Belenko, 1990). In 1990 State and Federal correctional facilities housed 715,649 inmates (Maguire and Pastore, 1994, p. 609). This figure rose to 825,559 in 1991 and increased to 883,656 in 1992 (Maguire and Pastore, 1994, p. 602). The nation's prison population reached 948,881 in 1993. In 1994 the nation's prison population soared to over one million and this is expected to double soon after the year 2000. The United States imprisons 519 of its citizens per 100,000 population, which is one of the highest incarceration rates of any of the industrialized countries (Califano, 1995, p. 40).
Between 1978 and 1992, the Nation's jail population increased by approximately 250%. Drug offenses accounted for 23% of charges against local jail inmates in 1989, compared to about 9% in 1983 (BJS, 1990). As of 1992, local jails in the United States held an estimated 444,584 persons--with about quarter there on drug charges. The most recent estimate of the number of juveniles in custody was 93,945 in 1989, representing a 31% increase in custody rates since 1979. One of every nine juvenile detentions in 1988 was for drug charges, but 33% of drug offense cases resulted in detention for juveniles--higher than the incarceration rates for any other offense type (Office of Juvenile Justice and Delinquency Prevention, 1991). The number of adults on probation or parole has been spiralling for well over a decade, more than doubling in the decade of the 1980s. State and federal agencies reported that 2,843,445 offenders were on probation and 671,470 were on parole in 1993.
The bottom line is that much of the increase in the nations' prison, jail, probation and parole populations can be attributed to increased emphasis on punishing drug offenders and the increasing severity of sanctions (Graham and Zedlewski, 1990). Unfortunately, it is not possible to reliably extract the amount attributable to enforcement of the marijuana laws, especially distinguishing between possession and sales/distribution offenses.
References
ABC NEWS. April 6, 1995. 'America's War on Drugs: Searching for Solutions.' Television Documentary.
ALDRICH, M.R. AND T.H. MIKURIYA. 1988. 'Savings in California Marijuana Law Enforcement Costs Attributable to the Moscone Act of 1976 - A Summary.' Journal of Psychoactive Drugs 20(1):75-81.
BACHMAN, J.G., L.D. JOHNSTON, P.M. O'MALLEY, AND R.H. HUMPHREY. 1988. 'Explaining the recent decline in marijuana use: Differentiating the effects of perceived risks, disapproval, and general lifestyle factors.' Journal of Health and Social Behavior 29:92-112.
BELENKO, S. 1990. 'The impact of drug offenders on the criminal justice system.' In R. Weisheit (ed.), Drugs, Crime and the Criminal Justice System. Cincinnati, OH: Anderson Publishing Co.
BUREAU OF JUSTICE STATISTICS. 1990. Jail inmates, 1989. Washington, DC: U.S. Department of Justice, Bureau of Justice Statistics.
BUREAU OF JUSTICE STATISTICS. 1992. National Update. Washington, DC: U.S. Department of Justice, Bureau of Justice Statistics, D.C. October, 1992.
BUREAU OF JUSTICE STATISTICS. 1994a. 'Fact Sheet: Drug Data Summary.' Washington, DC: U.S. Department of Justice, Bureau of Justice Statistics.
BUREAU OF JUSTICE STATISTICS. 1994b. Comparing Federal and State Prison Inmates, 1991. Washington, D.C.: U.S. Department of Justice, Bureau of Justice Statistics.
BUREAU OF JUSTICE STATISTICS. 1995. Felony Sentences in State Courts -1992. Washington, D.C.: U.S. Department of Justice, Bureau of Justice Statistics.
CRIMINAL JUSTICE NEWSLETTER (CJN). 1994. '21% of Federal prisoners found to be low-level drug offenders.' Vol. 25(3): p. 7.
CALIFANO, JOSEPH A. 1995. 'It's Drugs, Stupid,' The New York Times Magazine (January 29, 1995), p. 40.
CALIFORNIA HEALTH AND WELFARE AGENCY. 1977. A first report of the impact of California's new marijuana law (SB95): As requested by the legislature. Health and Welfare Agency, State Office of Narcotics and Drug Abuse.
CENTER FOR SUBSTANCE ABUSE RESEARCH. 1993. 'Marijuana Use Up Among Booked Arrestees,' Vol. 2, No. 37 (September 20, 1993), College Park: University of Maryland.
CENTER FOR SUBSTANCE ABUSE RESEARCH. 1995. 'Increasing Number Report Marijuana as Most Prevalent Drug Used by Adult Male Arrestees,' Vol. 4, No. 8 (February 27, 1995), College Park: University of Maryland.
CENTER FOR SUBSTANCE ABUSE RESEARCH. 1995. 'Marijuana Rising as Alcohol Declines as Primary Substance of Abuse Among Juvenile Treatment Clients in Maryland,' Vol. 4, No. 17 (May 1, 1995), College Park: University of Maryland.
CHALSMA, ANDREW LOCKWOOD AND DAVID BOYUM. 1994. Marijuana Situation Assessment. Washington, D.C.: Office of National Drug Control Policy, September.
CHAMBERS, CARL D. AND JAMES A. INCIARDI. 1971. An Assessment of Drug Use in the General Population of New York State. New York: New York Narcotic Addiction Control Commission.
DRUG ENFORCEMENT ADMINISTRATION. 1994. 'Drug Legalization: Myths and Misconceptions.' Washington, D.C.: U.S. Department of Justice.
FEDERAL BUREAU OF INVESTIGATION. 1994. Uniform Crime Report 1993. Washington, D.C.: U.S. Department of Justice.
GRAHAM, M. AND E. ZEDLEWSKI (EDS.) 1990. Searching for Answers: Research and Evaluation on Drugs and Crime. Washington, DC: U.S. Department of Justice, National Institute of Justice.
INCIARDI, J.A. 1981. 'Marijuana Decriminalization Research,' Criminology 19:1 (May) p. 155.
MAGUIRE, KATHLEEN AND ANN L. PASTORE, EDS. 1994. Sourcebook of Criminal Justice Statistics 1993. Washington, D.C.: U.S. Department of Justice, Bureau of Justice Statistics, USGPO.
NATIONAL ACADEMY OF SCIENCES. 1982. An Analysis of Marijuana Policy. Washington, DC: National Academy Press.
NATIONAL INSTITUTE OF JUSTICE (NIJ). October, 1993. 'Drug Use Forecasting, 1992 Annual Report.' NIJ Research in Brief. Washington, D.C.: NIJ.
NATIONAL INSTITUTE OF JUSTICE (NIJ). November, 1994. 'Drug Use Forecasting in 1993: Annual Report on Adult Arrestees.' National Institute of Justice, U.S. GPO 387-159/00045.
OFFICE OF JUVENILE JUSTICE AND DELINQUENCY PREVENTION. 1991. Juveniles Taken into Custody: Fiscal Year 1990 Report. Washington, DC: U.S. Department of Justice, Office of Juvenile Justice and Delinquency Prevention.
OFFICE OF NATIONAL DRUG CONTROL POLICY. 1994. Pulse Check: National Trends in Drug Abuse. Washington, D.C.: Executive Office of the President.
SLAUGHTER, J. 1988. 'Marijuana prohibition in the United States: History and Analysis of a Failed Policy.' Columbia Journal of Law and Social Problems 21(1): 417-475.
SOLOMON, DAVID (ED.) 1966. The Marihuana Papers. N.Y.: New American Library.
SUBSTANCE ABUSE AND MENTAL HEALTH SERVICES ADMINISTRATION. 1993. National Household Survey on Drug Abuse: Main Findings 1992. Rockville, MD: U.S. Department of Health and Human Services.
SUBSTANCE ABUSE AND MENTAL HEALTH SERVICES ADMINISTRATION. 1994. Preliminary Estimates from the Drug Abuse Warning Network (Advance Report Number 8). Rockville, MD: U.S. Department of Health and Human Services.
THE WHITE HOUSE. 1995. National Drug Control Strategy Budget Summary. Washington, DC: Executive Office of the President.